Result
Final Map 1:
Tree Shadow Influence Analysis of North Dunbar Community during Summer
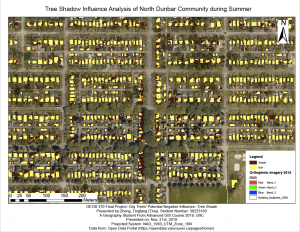
For Detailed map see link:city_tree_shade_summer
Final Map 2:
Tree Shadow Influence Analysis of North Dunbar Community during Winter
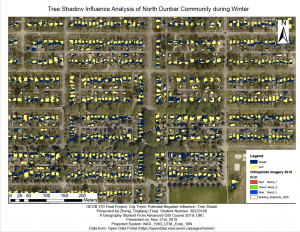
For Detailed map see link: city_tree_shade_winter 1
Final Map 3:
Tree Falling Damage Influence Analysis of North Dunbar Community
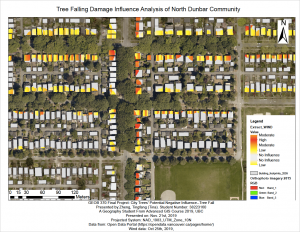
For Detailed map see link:city_tree_wind
The above GIS analysis was conducted under an idealized situation. In reality, the actual tree shadow influence is subject to sunlight intensity, and the falling tree damage is subject to wind power, tree truck firmness and tree height. However, this analysis can still prove that the unmanaged city can have potential negative influence on nearby houses.
Form the results of the first and the second maps, we can see many nearby houses stay in shaded area throughout the year, since the nearby tree is too tall and block most of the incoming sunlight.
|
Season
|
Total Roof Area (m^2)
|
Total Shade Coverage (m^2)
|
Shade Coverage %
|
|
Summer
|
24132
|
6336
|
26.26
|
|
Winter
|
24132
|
4535
|
18.79
|
Form above result, we can see that there is no significant difference between winter shadow coverage on each house and the summer shadow coverage on each house. Thus, we can conclude that the presence or the absence of leaves (or the crown size of each tree) is not the main factor causing high shadow coverage on each nearby house. This result further indicates that the city tree department should take care of every tree and prune them frequently throughout the year.
In addition, form final map 3, we can see over 50% of the nearby houses are experiencing the danger of fallen trees, especially, those houses located on the east side of Blenheim Street and houses located along 28th and 27th Avenue. These houses are having high risk because the street tree located next to them are very tall, which have a higher possibility of falling (King, 1986). And the trees not fall on houses could also fall on streets, which will block traffic.
All of above analysis show that if the city cannot manage the urban trees properly, it will bring negative influence as well as danger to residents nearby.
