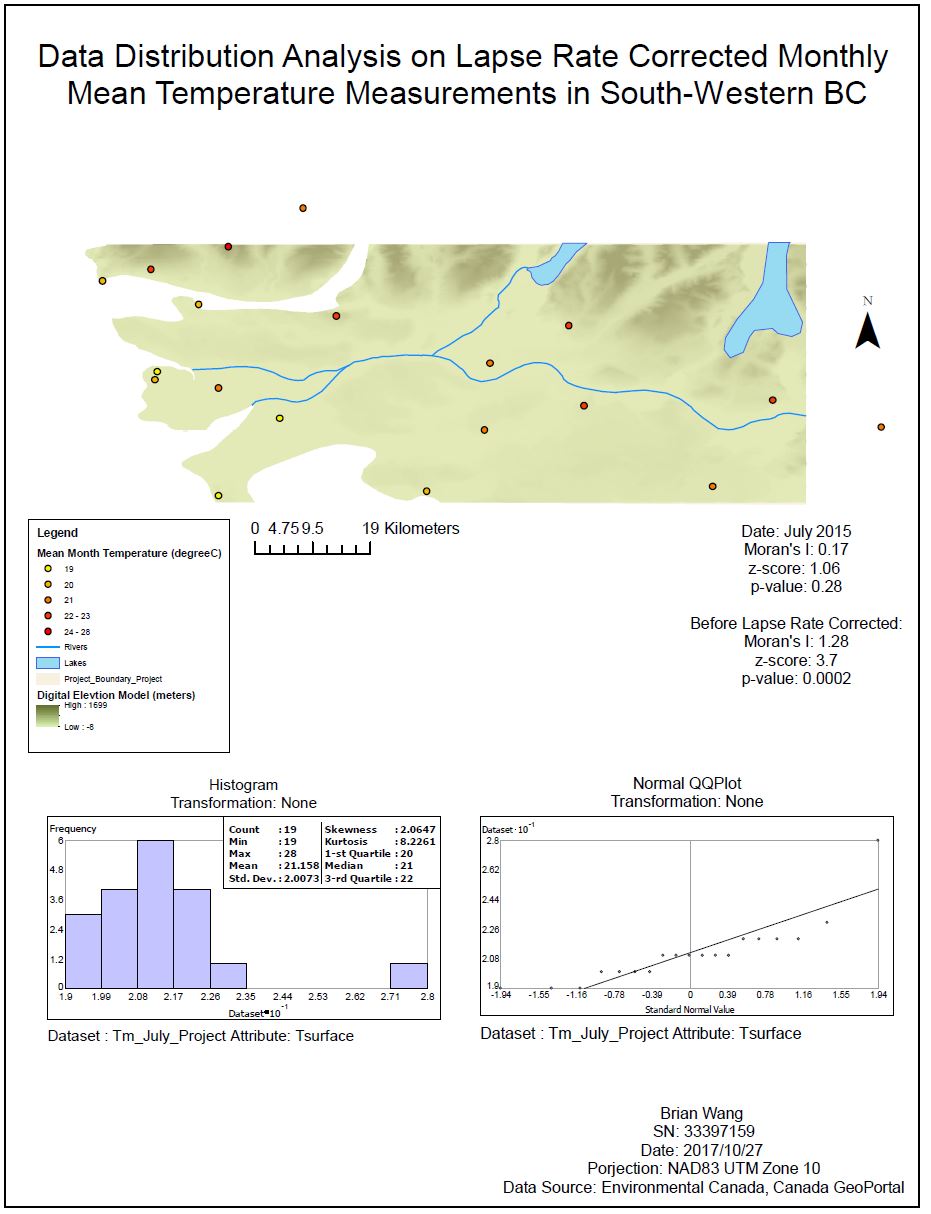
Figure 2. Data distribution analysis on lapse rate corrected monthly mean temperature measurements in south-western BC
Before kriging and IDW are performed, all temperature values are adjusted using the dry adiabatic lapse rate (DALR) formula. This shows the temperature that would be measured at that location if its elevation is brought down to sea-level. The elevation values are obtained from the DEM of the region and this normalizes the data for interpolation.
The distributions of the corrected value are then analyzed before interpolation. The histogram of the distribution shown data points to be skewed left and the Normal QQPlot showed two outliers that differs significantly from the rest. The outliers might be caused by local temperature abnormality hence it was not deleted merely to improve the statistics of the interpolation. A spatial autocorrelation analysis was performed on the values and returned with Moran’s I value is 0.17 with a p-value of 0.29.
A second order trend was recognized through trend analysis of the data points and will be removed during kriging steps. The three data criteria are met for kriging. The data is normally distributed even though they are highly skewed left. The data points are stationary and no trends will exist after the 2nd order trend is removed.