Given the data accessible within the time frame of this project, and based on the variable selected by Cooper and McLaughlin (2010), four variables were selected for analysis:
- Solid geology: The lithology of the bedrock of the coast has strong implications for the strength of the coastline. Sedimentary rocks are significantly weaker than metamorphic or igneous rocks (Suddeth & Burleyi 2010), which gives rise to a greater susceptibility to coastal erosion. Metamorphic rocks are systematically weaker than igneous rocks.
- Elevation: Low lying areas that are closer to the mean sea level (with elevations from 0 – 5m) are significantly more susceptible to inundation.
- Aspect: The strength of a storm and its surges are often a function of its fetch before landfall. Slopes that face out towards the Pacific Ocean (northwesterly and westerly) are much more exposed to storms with a large fetch relative to the slopes that face the Strait of Georgia, and are thus ranked as such.
- Inland Buffer: Coastal impacts tend to be limited to the coast – the further inland a region, the more protected it is, and less sensitive it is to coastal effects.

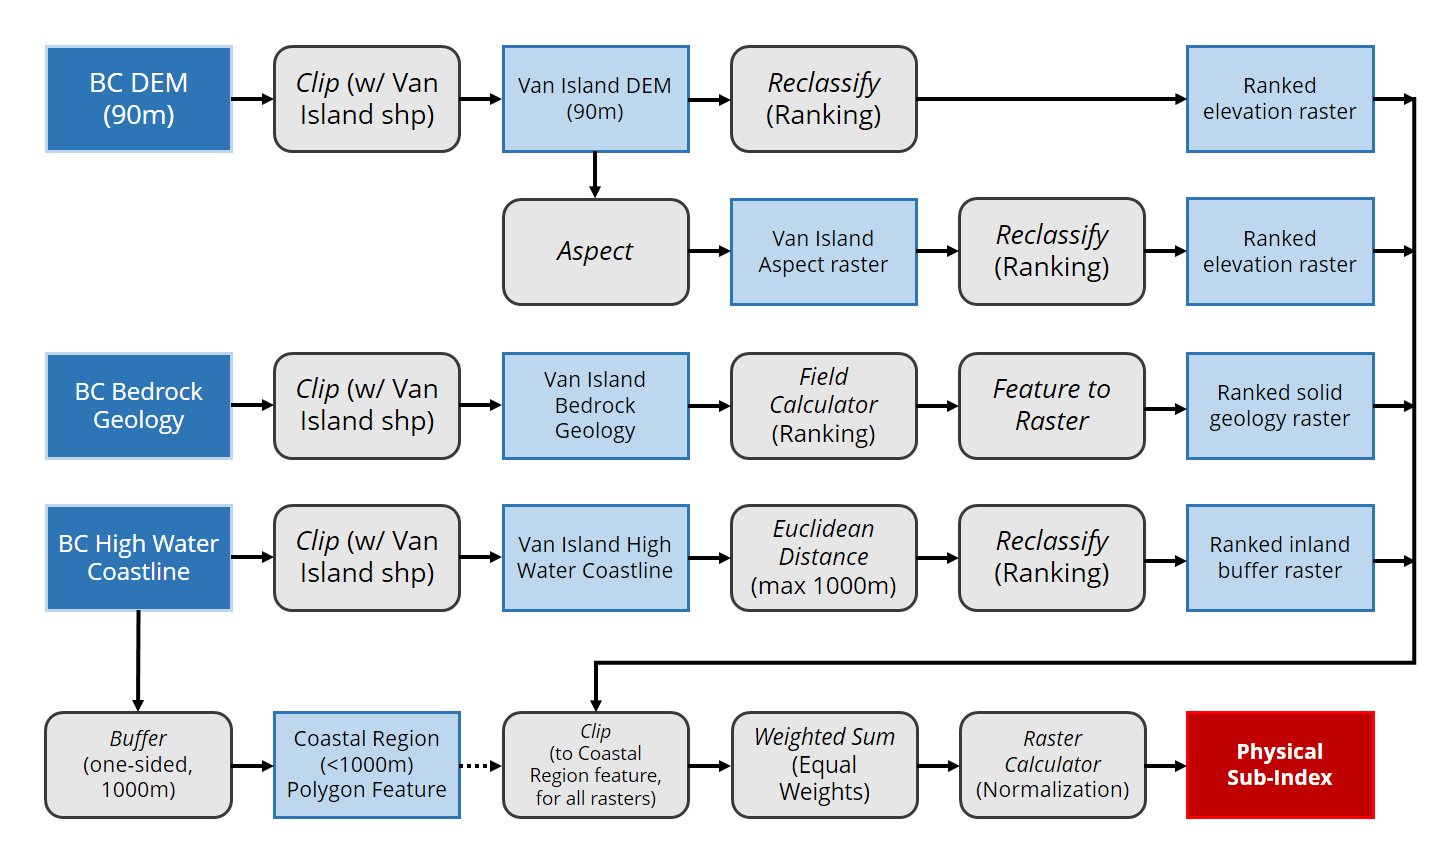
Data Processing
Elevation
Digital Elevation Models (DEM) at a resolution of 90m were obtained from GeoGratis and reclassified by elevation to represent the ranks outlined above. The obtained DEM was resampled to produce a DEM of a 500m resolution, and reclassified again to obtain the elevation rankings with a different scale.
Aspect
Aspect rasters were generated using the 90m and 500m DEM rasters noted above. The reclassify tool was used to categorize and rank the slopes of the area depending on their orientation.
Inland Buffer
A high-water coastline polyline feature was obtained from the Canadian Hydrographic Service and used to generate euclidean distances up to a maximum of 1000m. The resultant raster was then reclassified according to the table above, at resolutions of 90m and 500m.
Solid Geology
Bedrock geology shapefiles were obtained from Natural Resources Canada. The solid geology of Vancouver Island was isolated by selection by location with a multipart polygon representing the landmass. An additional attribute field was used to rank the geology of the area, following the methodology outlined in the table. This was then converted into a raster with varying resolutions. (90m, 500m)