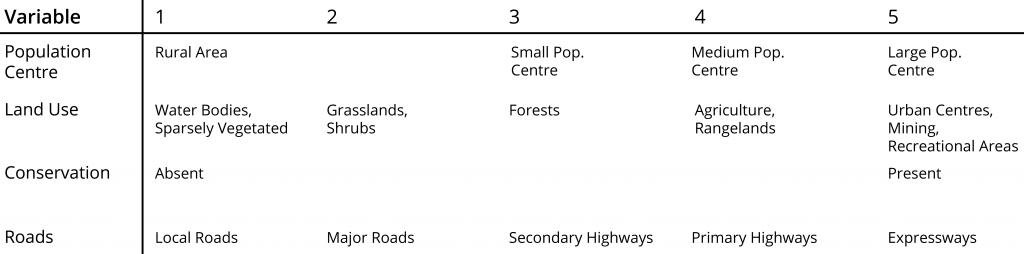
Given the data accessible within the time frame of this project, and based on the variable selected by Cooper and McLaughlin (2010), four variables were selected for analysis:
- Population: An evaluation of the impacts of climate change from an anthropocentric standpoint often classifies the existence and extent of settlement as an important factor. The more people that live in a coastal area, the greater the risk of loss of life and livelihood.
- Land Use: The loss of urban and economic areas (agriculture, industry, recreational) is given precedence over vegetated, unpopulated, natural areas, given the financial damages that might be incurred upon the destruction of the former.
- Conservation Areas: The presence of wildlife conservation areas and National/Provincial Parks is often given great social value – the loss of which could be considered significant as a whole to society.
- Roads: This is representative of the infrastructure put into place in coastal regions, as roads function as both an important line of communication and transport. The loss of major highways and expressways would entail a higher financial burden than the loss of a local, smaller road.
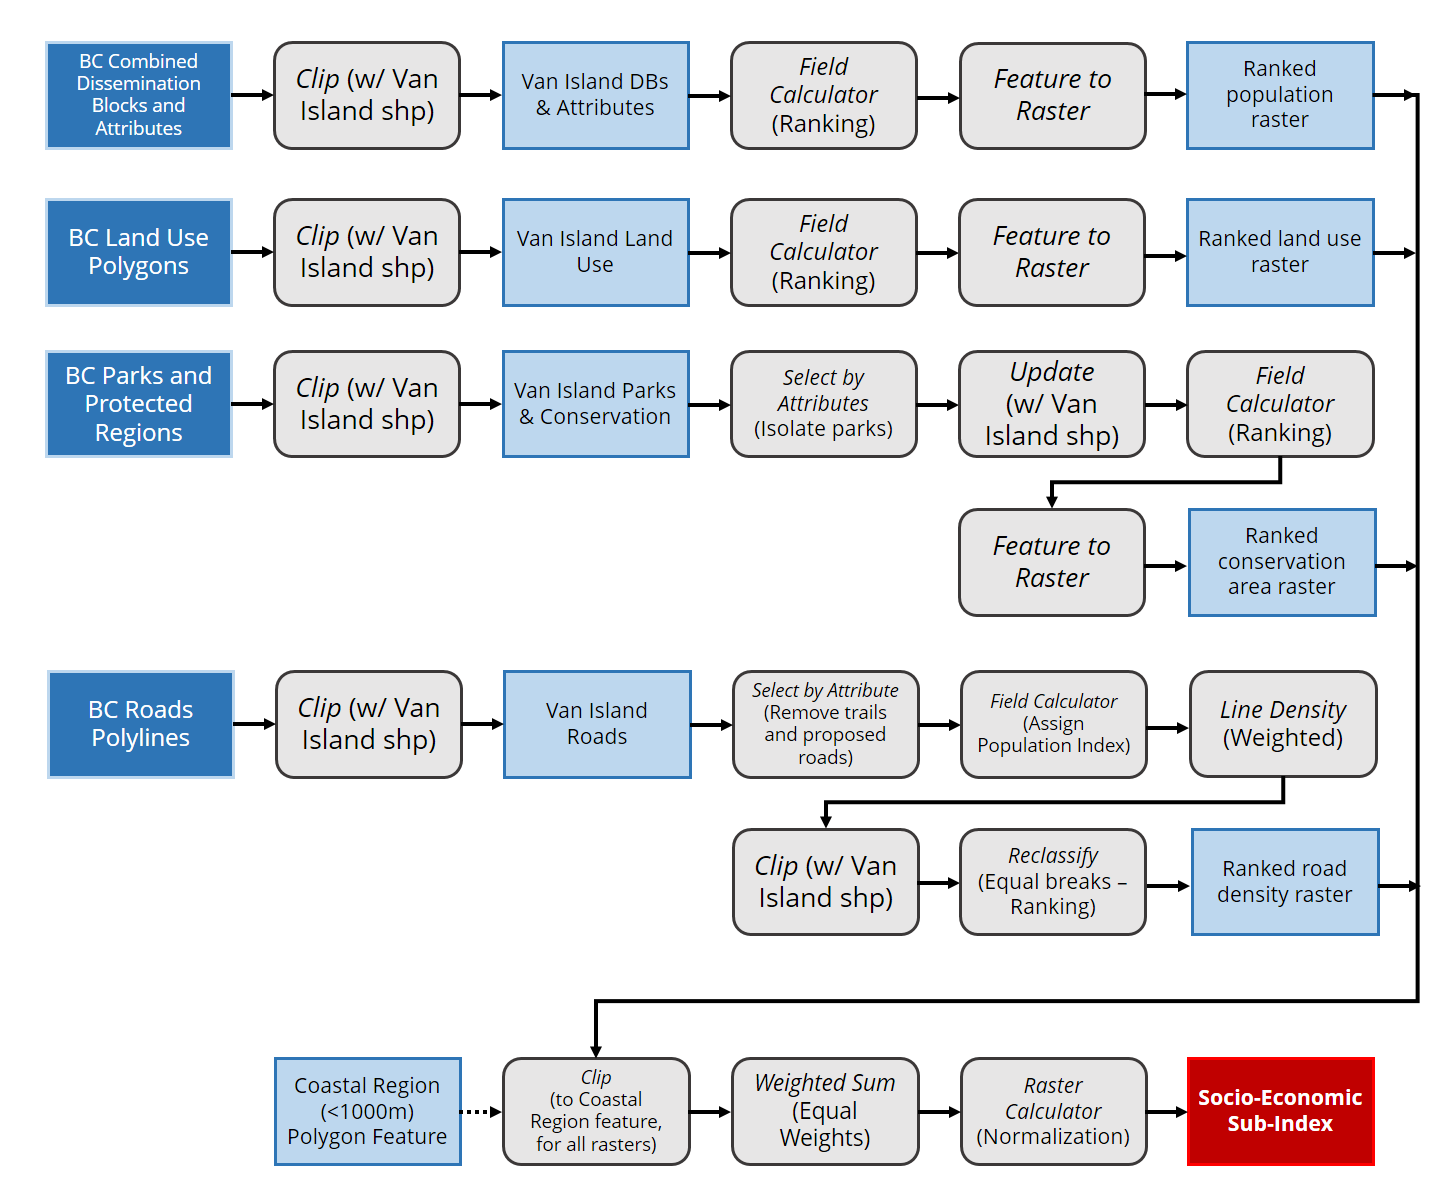
Data Processing
Population
Population data linked to geographic shapefiles was obtained from the UBC Library, and assessed on the dissemination block level. Population centres within the dissemination blocks had been classified under four categories with regards to their population size (Rural: <1,000; Small: 1,000-29,999; Medium: 30,000-99,999; Large: >100,000). These categories were ranked according to the table above in a separate attribute field, and converted to a raster.
Land Use
Land use shapefiles were obtained from a Canada-wide dataset from the Ministry of Forests, Lands and Natural Resource Operations, and were classified into the categories above by descriptive attributes within the features. Once classified, the polygons were converted to a raster.
Conservation Areas and Parks
The locations of conservation areas and parks on Vancouver Island were obtained from the DMTI CanMap Parks dataset. The polygons were combined with a shapefile of the land mass of Vancouver Island, and classified according to the ranking system in a separate attribute field. This was then converted into a raster.
Roads
Polyline features representing the roads of Vancouver Island were obtained from a DMTI CanMap Content Suite dataset, and isolated by selection by location with a shapefile of the land mass of the island. The roads were ranked according to their given class in the dataset, as outlined in the table above. Proposed roads and trails were ignored for this analysis. The ranking attribute was used as a Population field for the Line Density function, which was used to create a heat map of roads on Vancouver Island at resolutions of 90m and 500m. This heat map was reclassified according to equal interval breaks, and given the ranks 1 to 5.