The socio-economic sub-index was constructed by the arithmetic sum and normalization of four variables (population size, road density, conservation areas, land use). The rasters generated with the ranking classification system are given below for each variable.
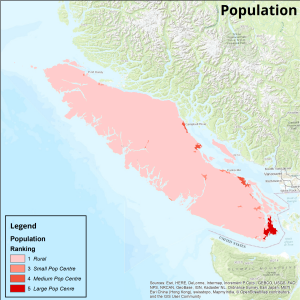

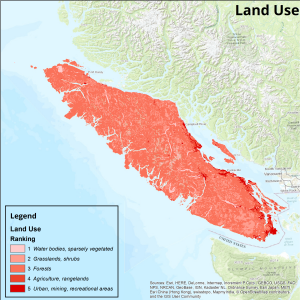
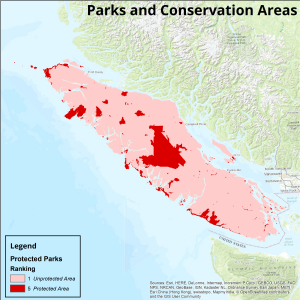
Owing to the fact that the variables selected to represent the socio-economic status of the coasts were centred around the concepts of large population and sites of concentrated infrastructure located around Vancouver Island, it is perhaps unsurprising that the socio-economic sub-index identified the major cities of the island as the greatest at risk. Much of the population of Vancouver Island is concentrated about the communities along the Strait of Georgia, in which roads (as well as other infrastructure) and urban land uses follow. These larger settlements (such as Nanaimo, Parksville, Campbell River, Courtenay, and Victoria) were therefore assigned the greatest susceptibility. As the provincial capital of British Columbia, the coastal regions surrounding Victoria were assigned the greatest values for risk.
A map of the socio-economic sub-index values is shown below. After normalization of the index to a scale of 0-100, the sub-index values were reclassified into 5 ranks, which are defined as:
- Rank 1: 0 – <20, Very Low Risk
- Rank 2: 20 – <40, Low Risk
- Rank 3: 40 – <60, Moderate Risk
- Rank 4: 60 – <80, High Risk
- Rank 5: 80 – 100, Very High Risk