The Rising Concern of Soft Drink Consumption in Children

We’ve all been taught since we were kids that sugar is bad for not only your teeth and waistline but also your health. Now, more than ever, North Americans are feeling the effects of excessive sugar consumption. With over 50% of Canadians describing themselves as overweight or obese, one of the main culprits of this issue is the uptick in consumption of soft drinks.

File:Defense.gov photo essay 090305-F-5855M-121.jpg

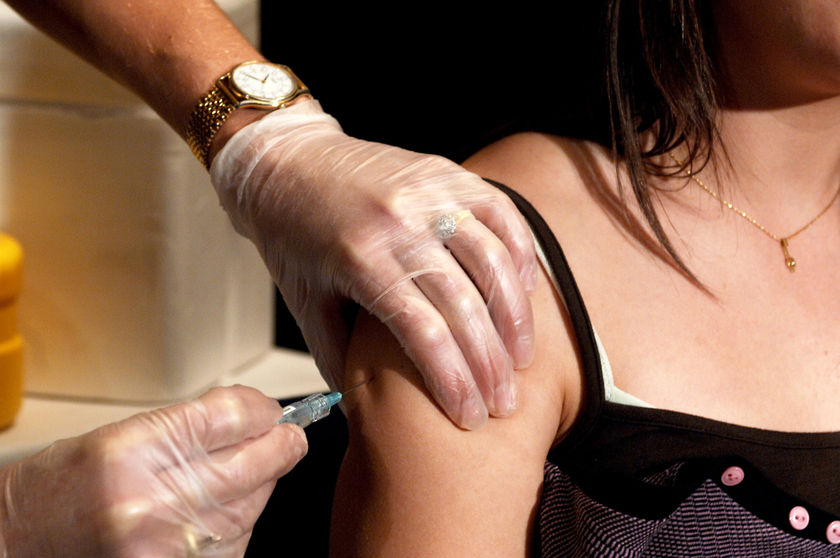
Figure 1: control soda consumption, especially in children. Source

Although most of us understand that soft drinks are bad for our health, we often fail to fully appreciate the scope of the damage that it can cause, especially to our children. Recently, a research group out of the US have discovered that the damage caused by excess consumption of soft drinks, especially in children, is greater than we think. In their study, published in the Journal of Pediatrics, the researchers described soft drink consumption as having a correlation with “aggressiveness, lack of attentiveness, and isolation.” They reported that in a study of nearly 3000 children, “increased daily soda consumption where 43% of the kids consumed at least 1 soft drink a day led to an increase in aggressive behavior”. Their study accounted for both males(52%) and females (48%) as well as ethnicity where African Americans represented 50% of their study while the other 50% was made of Whites and Hispanics. Aggressiveness, the most concerning attribute affected by soda consumption was calculated to be up to 4.74 points higher(95% CI) in children with daily soda intake.

YouTube Preview Image

Figure 2: Video discussing a study on soft drinking consumption being linked to aggressive behavior.

In a separate study, it was revealed that the risk of increased aggressiveness upon soft drink consumption was especially prevalent in children who lacked a consistent access to healthy and affordable food (King, 2016). Therefore, the importance of providing kids with a healthy meal everyday cannot be emphasized enough. If you are a parent guilty of microwaving dinners three days in a row, consider the effect it has on your children, not only physically but also mentally. Obviously, the prevention of soft drink consumption also cannot be understated. This applies for people of all ages. A good strategy that you can apply to combat soft drink consumption is to periodically restrict yourself; that is, if you consume 4 soft drinks a day, reduce that to 3, then 2, then 1, and eventually none. As a substitute consider drinking milk, or making yourself a healthy smoothie, or if you’re lazy, water is as good as any other option!


Vaccine Induce False Positives in Preventative HIV Trials

Everyday there are over 7500 cases of human immunodeficiency virus, HIV, that are reported all over the world and the need for an effective Food and Drug Administration-approved vaccine is constantly growing. Researchers have proposed various approaches that have reached clinical trials of 30,000 participants, however, preventative HIV-1 vaccines have the risk of giving false test results. This is due to the ability for trial participants to generate HIV antibody responses that are induced by the vaccination. During routine HIV testing that use antibody detection methods, false positives may be found and can cause an incorrect diagnosis.

Fig. 1: Vaccination via Needle                       Source: Flickr by VCU CNS

This study assesses the appearance of vaccine induced sensitive/reactivity, VISP, in HIV vaccine trials, which were delivered in different systems and with HIV inserts. In 2010, Dr. Baden and her team used three FDA approved enzyme immunoassay (EIA) HIV antibody kits, which detect VISP by identifying the antibodies that were induced and a diagnostic HIV algorithm that examines the frequency of VISP in healthy adults.

Out of the 2176 participants that were free of the HIV infection and given a vaccine, 41.7% of them had VISP. However, the frequency of VISP varied between vaccine types; 86.7% adenovirus 5 product, 53.4% of poxvirus and 6.3% of DNA -alone product recipients that were given those vaccines had VISP.

Fig. 2: 2176 Non-HIV vaccine recipients with true negative or false positive results

The HIV testing kits also varied in VISP results between 40.9% and 8.8% of participants. Their findings suggested that VISP depended on the vaccine that was administrated as well as the EIA used.

Fig. 3: Microscopic HIV Budding                                    Source: Wikipedia

If VISP induces false positive results, it could affect these participants’ opportunity to donate blood or organs, obtain medical or life insurance, hired for employment and even being able to immigrate into certain countries. Testing for VISP is crucial after every study to ensure no societal harm or incorrect reports enter the health system. However, some clinicians may glance over full patient history due to added time and cost.

The development for a vaccine gets closer to becoming approved but there are still many obstacles that researchers must face. With the race against the clock, people who are diagnosed with HIV slowly acquire AIDS if not treated. If researchers can find a preventative vaccine, HIV/AIDS could be avoidable in the future.

-Tiffany Liew


Hummingbirds: World’s Best Athlete

Beneath the ethereal dainty figure of a hummingbird is a powerhouse of energy. Hummingbirds have an average of 80 wingbeats per second, 1000 heartbeats per minute, and consume 40 milliliters of oxygen per gram per hour. For comparison, the world’s top athletes reach peak oxygen consumption of a measly 4 milliliters per gram per hour.

Figure 1: A hovering hummingbird burns energy faster than any mammal

Kenneth C. Welch Jr. at the University of Toronto, has made hummingbirds his life’s work, and his most recent publication found out that during strenuous hovering flight, bigger hummingbirds are more efficient energy users than small ones.

“A hummingbird can easily hit 40 milliliters of oxygen per gram per hour. And if I ask the hummingbird to do extra, if I give it a little bit of extra weight to wear, that can go up to well above 60. So, their tissues are using oxygen at rates that are many, many times what we can possibly achieve,” Welch said to the New York Times.

This data is published in the Proceedings of the Royal Society B: Biological Sciences, showing a positive relationship between flight efficiency and body mass. 

Figure 2 The relationship between body mass and hovering metabolic rates using Phylogenetic generalized least-squares regression analysis.

Table 1 Regression coefficient for the relationship between body mass (g) and hovering metabolic rate. All variables were logarithmically transformed before analysis. 95% confidence intervals are provided with the slopes within the brackets.

But why do hummingbirds need this much oxygen in the first place? Well, they need it to metabolize the delicious sugary nectar in their diet, and here’s how it works.

Hummingbirds are better than most animals (including us, mere humans) in switching between fat and sugars to power their muscles. Since they feed on nectar that is equal parts fructose and glucose, they have evolved a way to send the fructose directly to their muscles. Humans, on the other hand, mainly fuel our bodies with glucose, and fructose goes straight to fat.

Hummingbirds have streamlined this process by immediately burning sugars that they have just swallowed.

Welch converted this into human-scale, “Ok, if I scale one of my hummingbirds up to adult male human size, my size, how much sugar would I need to drink per minute if I were theoretically a hovering hummingbird? It turned out to be right around the amount of sugar that’s in a can of Coca-cola per minute.” (New York Times)

This makes hummingbirds extremely efficient in converting sugars to spent energy, the best compared to any other bird or mammal. However, at night, its metabolism slowed to a crawl. It’s in a state called “torpor”. Heartbeat and temperature dropped so low that the bird is using 2% of the energy it would used for flying around during the day. This mechanism evolved as a way to survive, otherwise they would starve to death in the hours they spent resting.

With this extremely efficient streamlined process, Hummingbirds are indeed the World’s best athlete.


Image

Risks of impaired driving

Researcher at Colorado State University stated that 33 out of 100 high school graduates reported they have at least ridden once with an impaired driver.

Vehicle accidents are the leading cause of death for many young adults. The act of adolescents driving while impaired or riding with an impaired driver has become very common, due to consumption of marijuana, alcohol, or other drugs. However, it is more likely that young adults will ride with an impaired driver by marijuana rather than a driver who is drunk.

(credits: http://blog.allstate.ca/new-laws-on-the-way-to-combat-impaired-driving/)

Students who have graduated from high school for one or two years were asked various health-related questions in a study, including questions such as “during the past 12 months, how many times did you ride in a vehicle driven by someone who had been drinking alcohol?” and the question was repeated for marijuana and other drug users too. People who have been driven by an impaired driver was given by 23 percent of marijuana users, 20 percent of drunk drivers, and 6 percent of other drug users.

(credits: http://www.calgary.ca/CSPS/PSC/Pages/Report-impaired-drivers.aspx)

The participants were also asked who the driver was: a friend, family member, unknown person around the same age, or an older relative, unknown-adult. It was more common for people to ride with peers that are impaired compared to older individuals. Riding with an impaired driver enforces this act to be repeated and seen as acceptable. Furthermore, individuals who ride with impaired drivers often become impaired drivers themselves. Therefore, it is important to educate adolescents early on the risks of impaired driving .


Warming oceans may lead to a sharp decline in fish catches by 2300

Figure 1: Fish being caught in the ocean Source: NOAA Fisheries

As we all know, fish is one of the world’s most essential resources. Not only is it  a staple in many diets, but it’s also important for animal feed production and has become valuable in the pharmaceutical industry. In the past couple decades, nearly 90% of fish was caught in oceans and seas. Although presently, its abundance may not be much of a worry to fisheries for sufficiently supplying this resource, researchers discovered that by 2300, productivity in fisheries could significantly decrease by up to 60%.

In a recent study published in Science on March 9th, 2018, climatologists at the University of California, Irvine (UCI) have created a computer simulation of the earth subjected to 300 more years of global warming, from which they found a 20% decrease in productivity of global fisheries and an alarming 60% decrease for fisheries in the North Atlantic. The simulation caused a 9.6-degree Celsius increase in surface air temperature which is roughly 10 times warmer than what it is now. This model shows that sustained warming of the earth will cause rising ocean temperatures, changes in wind patterns, and the melting of ice sheets along Antarctica (Figure 2)  – all of which harm marine ecosystems especially in the north.

Figure 2: Melting ice sheets of Antarctica Source: Pixabay

These changes directly impact the growth of phytoplankton, an organism at the lowest level of the marine food chain. Currently, nutrients in the ocean rise to the surface around Antarctica and flow to the north supporting the growth of marine organisms including phytoplankton and fish. However, with increasing ocean temperatures, comes an increase in phytoplankton by 52% due to the favourable growth environment made by sustained warming. Larger phytoplankton populations prevent nutrients from moving into the north and “…end up trapping the nutrients near Antarctica” states J. Keith Moore, a professor at UCI.

The simulation creates a picture of the future, providing us another reason to “…aggressively reduce our fossil fuel use and emissions of greenhouse gas pollutants” says Moore, in order to sustain fish population in the north for more centuries.

-Annelie Reyes


Increasing amounts of plastic in the ocean

Plastic is an material that we all use on a daily basis, sometimes without thinking about it. Our food and drink come stored in plastic containers, our toiletries do too. our clothes are sometimes made of plastic and our cars contain plastic parts. Plastic is highly useful because it is easy to produce, cheap to buy, and usually lasts a long time. After we have finished using the plastic, what becomes of it? Where does it go? Sometimes we recycle it, but not often enough. And often, it ends up in the ocean, causing harm to plants, animals and humans.

Article image

Photo: https://www.chinadialogue.net/culture/10123-Plastics-are-making-our-oceans-sick/en

The world produces about 300 million tonnes of plastic every year. Some of that plastic is used for long periods of time, such in car parts, while other forms of plastic are used only briefly, such as disposable drink bottles. When all this plastic is disposed of, some of it gets recycled, some sent to landfills, and some incinerated. Still more of it finds its way into our oceans. It has been estimated that this amount is between 4.8 and 12.7 million tonnes every year, a number which continues to increase.

Photo: http://www.takepart.com/article/2014/12/10/worlds-ocean-plastic-pollution-problem-just-got-bigger–lot-bigger

But once the plastic is in the ocean, it doesn’t just disappear. It has to break down into smaller chemical particles over time, which, depending on the type of plastic and the environment of degradation, can be as short as 50 days or as long as a thousand years.  Often the plastic lifetimes are on the larger side of this range. Within that time, the plastics can be ingested by animals, often resulting in their death, which affects animals populations including our food sources such as fish. The plastic can also get caught on their bodies, or washed up on beaches, or slowly degrade and release harmful toxins into the water.

Despite being useful, plastics pose problems to the environment. They have already done damage, and we need to deal with the problems that have arisen, while preventing the situation from growing worse, while ensuring that we look after our planet. Plastic in the ocean is a bad idea, and a large problem we have to deal with.

Nathan Heyns.

How many calories are in that latte?

Many people look at nutritional information when grocery shopping. But do you know how many calories are in the food you eat out?

Do you know how many calories are in your favorite coffee? Photo by rport @flickr.com

Worldwide obesity has nearly tripled since 1975. Diseases associated with obesity and unhealthy lifestyles such as diabetes, heart disease, and some types of cancer have also dramatically increased. This poses a challenge for governments and public health agencies, as unhealthy habits and lifestyles are not easily changed.

New evidence suggests that including calorie labels in menus in restaurants helps reduce the calories people consume. Consumers often don’t even realise how many calories are in the food they order, so including the calorie information in the menu can help people make better choices.

The team of researchers looked at results from three separate studies, and concluded that including nutrient labels on menus can reduce the calories consumed by 12% per meal. This is the equivalent of walking into Starbucks, looking at the menu, and picking a Caramel Macchiato (250 Cal) instead of a Caffe Mocha (290 Cal, about 13% Calorie reduction). It may not seem like a dramatic change, but its a small step towards reducing calorie intake that adds up over several meals.

Researchers point out that there is still uncertainty surrounding this number. This is because other factors need to be studied as well as calories. Fat, sugar, and salt content are other pieces of information in nutritional labels but its effects on consumer behaviour have not been studied. Furthermore, little is known about the effects that nutritional labels have on consumers using vending machines due to lack of data.

More studies are required to fully understand this effect and how it can be used to improve consumers shopping and eating habits. It’s definitely a good start! Do you take into account nutritional information when dining out?

-Ana Brunner


A Rare, Deadly, Little-Known Disease? What are the Chances?

In February 2018, The World Health Organization (WHO) updated their list of priority diseases to research—diseases that most likely to lead to a global pandemic, including infamous diseases like Ebola (Figure 1), Middle East respiratory syndrome, and Zika. However, there’s one disease confusing many people, with the ominous name “Disease X”. Just what is this mysterious disease?

Figure 1: The Ebola virus magnified 108,000 times. Source: ARS Technica.

It turns out Disease X is the name given for an unknown disease, i.e. the WHO thinks it is likely a pathogen that we do not yet know about could cause the greatest devastation to humanity; this makes sense—if we don’t know how to respond to something, it would be probably have a dire impact.

But imagine this: we now know Disease X is a terrifying disease, with only mild symptoms the first few days, but is quickly followed by much more unpleasant symptoms and death, partially because we don’t know how to deal with it yet. We also know it’s a relatively rare disease.

Say you live in a village of 100 people, and the village’s water supply was infected so that anyone in the village has a 1% chance of contracting the disease. You don’t feel very well, so you take a test correctly identifying 95% of people with the disease. You then get the test, which identifies you as having the disease. At this point, you would probably be quite worried. How certain is it that you have the disease? You might think there’s a 95% chance—but fear not—it’s much lower than that! This is where Bayes’ Theorem (Figure 2) comes in handy.

Figure 2: Bayes’ Theorem (tailored for our example)

D represents you contracting the disease, and + represents being tested positive by the exam. P(D|+) would then be the probability of testing positive if you had the disease,  P(+) the probability of having the disease, and  the probability of a positive test (which consists of testing positive given that you have the disease, and testing positive when you don’t, i.e. a false positive). Plugging in these numbers, it turns out there is only a 16% chance of having the disease if you test positive!

This seems counterintuitive, but think about this: the test would likely identify someone with the disease, but also incorrectly identify 5% of the population as having the disease (Figures 3-4).

Figure 3: In a population of 100, 1 person will have the disease, while 5 people will be falsely identified. Graphic obtained from clker.com.

Figure 4: Your chances of having the disease are 1 in 6, or 16%. Graphic obtained from clker.com.

So if the test on average identifies 6 people as having the disease, how certain can we be that they actually all have the disease? That number would be 16% of 16% of 16%… six times: 0.002%, or basically zero.

In reality, most tests are less accurate than 95%. For example, a mammogram has a 18% chance of a false positive of breast cancer in healthy women.

Bayes’ Theorem has many applications in fields such as epidemiology (the study of the distribution of health and disease) and computer science. It’s so powerful, in fact, that this way of thinking has been given a name: Bayesian logic. So the next time you’re absolutely certain of something, you might want to think twice.

-Cliff Ng


Dangers of Distracted Driving

As the warm spring weather melts away the winter cold, an increasing number of people, young and old, consider learning how to drive.   Despite recent advances in technology optimizing driver safety, distracted driving remains a particular concern for new drivers.

Distracted driving is a factor in 25-50% of all car accidents. Source: Shutterstock via Jim Dodson Law

From 2005 to 2008, the number of distracted-driving fatalities increased 28.4% where 16 out of every 100 car-accident fatalities involved some form of distracted driving in the U.S.A.     In 2010, the National Highway Traffic Safety Adminstration reported 1 in 5 traffic fatalities involved a distracted-driver!  This shocking trend qualitatively corresponds to a growth in cell-phone usage in this period.

Using a driving simulator and a pool of 20 licensed drivers with on average 11 years driving experience, David Libby et al.  compared the response time and sensory processing distracted driver with and undistracted driver.   The average reaction time of a distracted driver increased over 41% when texting, adding 0.5 seconds to the baseline average response time of 1.2 seconds for the undistracted driver.   Libby et. al. also found that distracted drivers missed 50% of the stimulus located in the peripheral vision compared to 12% for the undistracted driver.

Lim and Chi studied the effects of cell-phone bans on the reduction of distracted-driving related incidents.  By studying car-accident data collected by state agencies, they developed a mathematical model to predict the outcomes of a cell-phone ban for distracted drivers.  Lim and Chi data analysis noted that for every 100 drivers between the ages of 18 and 34, 95 were likely engaged in some form of distracted driving.  Their model determined that for every 100 car-accidents, a cell-phone ban would reduce the risk of a fatality in 95 accidents.

Simply put, distracted driving kills.  Put down your phone and get home safe :).

Aydan Con

Image

New Device Could Help Understand Evolution

Are we closer to overcoming genetic mutations? A recently published paper in Science journal describes a device invented to study the effects of genetic mutations in individual bacterial cells.

The researchers found only one percent of the mutations resulted in cell death, whereas most of non-lethal mutations seemed to have no effect.

Genetic mutations fuel evolution, but they can be detrimental to humans. They are responsible for a range of problems plaguing humanity, like antibacterial resistance to cancer.  Determining the rates at which mutations occur is central to understanding genetic mutations.

Although gene mutation in bacteria have been studied for ages, they have been on large population of bacteria. These tests start by using millions of bacteria which replicate over many days, then the final colony is compared to the starting colony to find the rate of mutations over generations of bacteria.

Bacterial Cells Image courtesy – wikipedia

The problems with this approach is that you can only analyze a small number of samples, and the effects of mutations are an average seen in all the cells. Most lethal mutations are never seen, since those bacterial cells die before replicating to form a colony.

Researchers from institutes across France built a device called a “mother machine” to separate an individual bacterium, observe it replicate, and study its mutations over several generation.

This device was installed with hundreds of tiny tubes that could trap a single bacterial cell at a time. The cell division process was observed with  a microscope and if there was a mistake in genetic replication, it was labelled with a fluorescent tag – a molecule attached to a  biomolecule to track its activity.

The researchers found that all cells had the same likelihood of mutating. One cell was not more inclined to mutate than another cell.

The researchers watched 200 generations of bacteria that  had total of 20, 000 mutations.

Summary of the Effects of Mutation on Bacterial Cells   

Number of mutations observed Percent of all mutations (%)
Lethal mutations (caused cell death) 200 1
Harmful mutations (didn’t cause cell death) 40 0.2
Harmless mutations 19, 760 98.8
Total mutations observed 20, 000 100

Data source- Robert et al., Science (2018)

Only one percent  of the mutations were lethal to the cell, 0.2%  were harmful but did not kill  the cell. The rest of the time, the mutation does not affect the cell.

The bacterial cells were living in controlled environments conducive to cell growth. This means the cells were not exposed to environmental factors  that would result in natural selection. As a result, the researchers couldn’t determine if any of the harmless mutations were beneficial for bacteria’s survival in natural environments.

The researchers are planning to see the effects of surroundings on mutation by carrying out the experiments while changing the environment around the bacteria.

However, a controlled setting without natural selection reveals the rate of mutation inherent to cell replication, which can help scientists understand what drives mutation.

References:

Robert, L.; Ollion, J.; Robert, J.; Song, X.; Matic, I.; Elez, M. Science2018, 359(6381), 1283–1286.