Binge Drinking in the United States: The Growing Trend of Alcoholic Misuse

St. Patrick’s Day is a holiday most popular for sharing a glass of Guinness with friends. However, it is not commonly known that binge-drinking accounts for more than half of all alcohol related deaths in the United States annually.

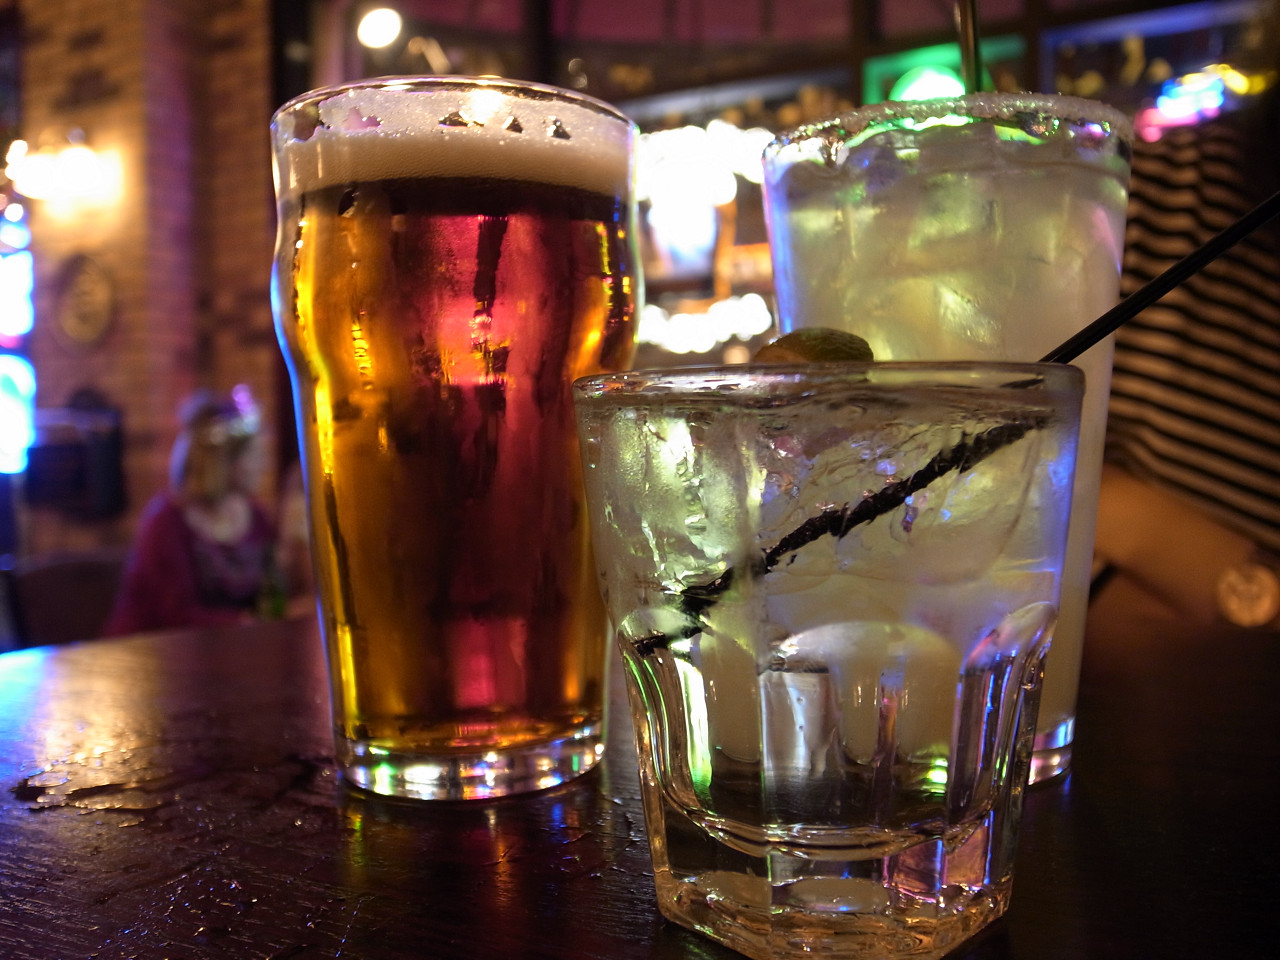
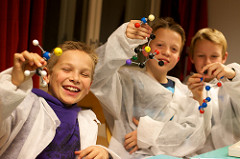
Figure 1: Alcoholic beverages Source: Flickr

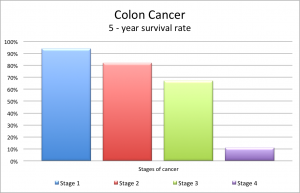
Binge drinking is defined as consuming more than five drinks in a two-hour span for men and consuming more than four drinks in a two-hour span for women was recently studied by the Center for Disease Control and Prevention. In this study, a drink can consist of a 12-ounce glass of beer, one 5-ounce glass of wine or one shot of hard liquor.

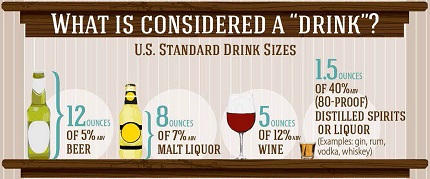
Figure 2: Guideline for what is classified as a “drink” Source: CDC

This study surveyed over 400,000 participants across the United States ages 18 and over about their drinking habits in the past 30 days. Some questions included the number of times participants drank, the amount of alcoholic beverages consumed and the most alcohol they consumed in one outing.

The results showed of the 17.5 billion reported drinks consumed, men were drinking four out of every five beverages. Men were also reported to consume twice the amount of alcohol compared to women.

They also found that adults over the age of 35 were consuming over half of all the reported drinks consumed.

Overall, one in six Americans were reported to have been binge drinking in the thirty day period surveyed. On average, the frequency was at least once a week with seven alcoholic beverages consumed.

It was reported that binge-drinking cost the United States $191 billion in health care expenditures, criminal justice costs and other related costs. With alcohol use disorder (AUD) on the rise each year, as reported by the National Epidemiologic Survey on Alcohol and Related Conditions, it is important to educate the public on the dangers of binge drinking and provide preventative measures through counselling.

As with anything in life, it is all in moderation.

-Brandon Kato

References:

1.http://www.ajpmonline.org/article/S0749-3797(17)30753-5/fulltext

2.https://jamanetwork.com/journals/jamapsychiatry/article-abstract/2647079?redirect=true

3. https://www.flickr.com/photos/pure-water/4236552628/in/photolist-7snruQ-e4ogE1-evWhFU-3gRJMK-68kLtR-grTep-9AF438-96tk3T-8ZEAW2-bo5LMu-8vxWjT-6Rtuu1-5qWhb1-UK6CHN-cHqfS-3PZkcE-8B6jac-sU67sc-8ZHBks-6vR66z-846qe6-9kbKUu-4wBBAW-kSzduM-a8ohb6-5BoCca-976jdc-5LkuxL-4fgkiE-a2TtfQ-788dqm-6cR178-8ZHF7L-6vVhMy-6kQonm-9h5TW3-nvUfYp-46TjW4-dmvwhX-7RzPV-72mANu-a82HkS-6vVhQ3-uTUH-8uWYuC-7WMFRM-aDKEo-5Bua2X-bysKZi-5By5Ro

4.https://www.cdc.gov/alcohol/fact-sheets/moderate-drinking.htm


Repetitive Negative Thinking Leads to Less Sleep

Sleeping cat. Image courtesy of: Emanuele Spies on Flickr

Have you ever woken up in the middle of the night unable to sleep because you are worrying about your future and you continue to think about the worst possible scenarios? No matter the reason, we all get negative thoughts once in a while and these thoughts can lead to less sleep than the required 7-9 hours for adults from ages 18 to 65. Researchers have found that people who sleep less than 8 hours a night are more likely to suffer from depression and anxiety.

Rumination is the act of repetitively dwelling on thoughts that cause anxiety and distress. Your brain cycles through problems without solving them and when this happens, it can lead to negative thinking. This is especially dangerous for people who are depressed or anxious because it is difficult to switch perspectives and look for solutions to the problems. Thus, rumination intensifies and so do anxiety and depression.

This year, researchers found that a shorter sleep duration is related to the difficulty of disengaging individuals from rumination. Jacob Nota and Meredith Coles at Binghamton University, conducted a study with 52 community members from ages 18 to 65 with heightened repetitive negative thinking and varying sleep durations. Of the 52 participants, 50% of them met the criteria for major depressive disorder, 44.2% met the criteria for generalized anxiety order, and 36.5% met the criteria for social anxiety disorder; some participants fit multiple categories.

Figure 1: Schematic of how Nota and Coles conducted the attention task. Seventy-eight trials were done.

They showed the participants positive (e.g. nature scenes) or negative (e.g. guns, knives) images paired with a neutral (e.g. household items) image. When the participant fixated on one image, researchers put the other image in a frame to direct the eyes and track eye movement as shown in Figure 1.

On average, 92% of the time, participants would look at the negative image first when paired with the neutral image. When the positive image was paired with the neutral image, participants would look at the neutral image first. Participants were also, on average, 79% slower disengaging from the negative image when paired with the neutral image as shown in Figure 2.

Figure 2: Average percent of participants that would engage with a type of image first and average percent of participants that would slowly disengage from a type of image.

After asking participants about their habitual sleep duration, 96% of those with a shorter sleep duration spent more time looking at the negative image than the neutral image and had difficulty fixating on the neutral image compared to the negative image.

Despite this interesting discovery, researchers are still evaluating how the timing and duration of sleep may contribute to the development of depression and stress. Further research can then allow psychologists to treat anxiety and depression by adjusting their patients’ sleep cycles to a healthier time.

Want to know more about negative thinking and how to stop it to get a good night’s rest? Check out the video above!

– Sara Djondovic

References

  1. Bergland, C. (2015). The Brain Mechanics of Rumination and Repetitive Thinking. Psychology Today. Retrieved March 18, 2018 from https://www.psychologytoday.com/blog/the-athletes-way/201508/the-brain-mechanics-rumination-and-repetitive-thinking.
  2. Binghamton University. (2018). People who sleep less than 8 hours a night more likely to suffer from depression, anxiety. ScienceDaily. Retrieved March 18, 2018 from www.sciencedaily.com/releases/2018/01/180104152947.htm.
  3. Gura, L. [Actualized.org]. (2014). Negative Thoughts – The Origin Of Negative Thinking & How To Eliminate It Forever. Retrieved March 19, 2018 from https://youtu.be/mggupbkTmWc.
  4. N. A. (n.d.). How Much Sleep Do We Really Need? National Sleep Foundation. Retrieved March 18, 2018 from https://sleepfoundation.org/excessivesleepiness/content/how-much-sleep-do-we-really-need-0.
  5. Nota, J. A. & Coles, M. E. (2018). Shorter sleep duration and longer sleep onset latency are related to difficulty disengaging attention from negative emotional images in individuals with elevated transdiagnostic repetitive negative thinking. Journal of Behavior Therapy and Experimental Psychiatry. 58, 114-122. https://www.sciencedirect.com/science/article/pii/S0005791617300629.
  6. Wehrenberg, M. (2016). Rumination: A Problem in Anxiety and Depression. Psychology Today. Retrieved March 18, 2018 from https://www.psychologytoday.com/blog/depression-management-techniques/201604/rumination-problem-in-anxiety-and-depression.

Simple blood test that can detect early stage cancer

A dividing lung cancer cell. Source: National Institues of Health

The Canadian Cancer Statistics estimated approximately 206,200 Canadians will be diagnosed with cancer in 2017 and 80,800 Canadians will die of cancer in 2017. In other words, about 1 in 2 Canadians will develop cancer in their lifetime, and about 1 in 4 Canadians will die of cancer. However, a cancer diagnosis fortunately does not mean a death sentence since the majority of cancers can be treated successfully if detected early. Cancer is a group of diseases characterized by the uncontrolled growth and spread of abnormal cells. If the cancer has spread, treatment becomes more difficult, and generally a person’s chances of surviving are much lower. Thus, the key to curing cancer is early detection.

Colon cancer 5-year survival rate. Data from Vogelaar et al.

For example, in colon cancer, if you detect cancer in stage four, only 11 percent of the people survive for five years. However, if you are able to detect this cancer early at stage one, over 94 percent of people will survive. Other types of cancers also have similar trends. However, unfortunately only 15 percent of people are detected at stage one, whereas the vast majority, 70 percent, are detected in stages three and four.

There are currently three best ways to screen for cancer. The first method is a medical procedure of colonoscopy for colon cancer. The second is a protein biomarkers, prostate-specific antigen(PST), test for prostate cancer. The third one is an imaging technique, mammography for breast cancer. However, they are highly invasive and require a large infrastructure to implement.

So, many scientists have researched to find better detection mechanisms for cancers, which is noninvasive, light in infrastructure, and highly specific. Dr. Jimmy Lin, a geneticist, and his research team have developed extremely sensitive blood tests, which can accurately detect the earliest traces of cancer DNA in the bloodstream. Even this technique does not use any radiation and is applicable to large population.

The blood circulatory system is crucial for us to survive, providing oxygen and nutrients to our cells, and removing waste and carbon dioxide. When cancer cells grow and die, DNA is shed into the blood system. Based on genomic sequencing technology, they were able to scan blood for fragments of DNA shed by cancers to detect these cancers early.

This technology was actually used to detect recurrence of cancers earlier than with conventional methods. As a result, the technique accurately predicted relapse in 12 of 15 patients about eight months before cancers were visualized by standard imaging method. Patients, who still have cancer DNA in the bloodstream, are at high risk of developing relapse since cancer cells that survive treatment can invade other organs as metastatic disease.

This means that the patients can get surgical intervention or therapies eight months earlier. More importantly, it means that the cancer would have grown and spread for eight months less, which is the matter of life and death for some patients. For some patients, this technique also discovered mutations that potentially causes drug resistance, which could help doctors to prescribe drugs to fight against specific mutations.

-Subi Kim

Source:

  1. Vogelaar, I. L., Ballegooijen, M., Zuber, A. G., Habbema, J. D., Kuipers, E. J. Effect of rising chemotherapy costs on the cost savings of colorectal cancer screening. JNCL, 2009, 20, 1412-1422. (accessed Mar 17, 2018).
  2. Canadian Cancer Society’s Advisory Committee on Cancer Statistics. Canadian Cancer Statistics. 2017, www.cancer.ca/Canadian-CancerStatistics-2017-EN.pdf (accessed Mar 17, 2018).
  3. National Institutes of Health. Cancer. 2018, https://www.nih.gov/about-nih/what-we-do/nih-turning-discovery-into-health/cancer (accessed Mar 17, 2018).
  4. Bardelli, A. Medical research: L Personalized test tracks cancer relapse. Nature2017, 545, 417-418. https://www.nature.com/articles/545417a (accessed Mar 17, 2018).
  5. Mendoza, J. Blood Test Catches Relapse in Early-Stage Breast Cancer Patients. AAAS2015. https://www.aaas.org/news/blood-test-catches-relapse-early-stage-breast-cancer-patients (accessed Mar 17, 2018).
  6. Murillas et al. Mutation tracking in circulating tumor DNA predicts relapse in early breast cancer. Science Translational Medicine2015, 7. http://stm.sciencemag.org.ezproxy.library.ubc.ca/content/scitransmed/7/302/302ra133.full.pdf (accessed Mar 17, 2018).

City noise linked to heart disease

Figure 1 shows motorcyclists as a source of noise pollution. Source: Wikimedia Commons

Every day, on our way to school, to work, or even to run errands, we’re exposed to all kinds of city noise. Loud noise from construction sites, sirens, public transportation and heavy road traffic can be an annoyance to many of us. When it comes to constant exposure to these kinds of noises, we usually worry about the damage it can make to our ears. But now, a recent review, published in the Journal of the American College of Cardiology on Feb 5, 2018, explores the connection between high levels of city noise and cardiovascular disease, showing  that noise pollution is more than simply just a disturbance but also a threat to our health at the cellular level.

Video: Noise Pollution Is Much Worse For You Than You Think by Tech Insider

Although there isn’t much evidence that noise directly causes heart problems, it is the symptoms from chronic stress induced by noise, such as increased blood pressure and heart rate, which ultimately lead to unfavorable effects on the cardiovascular system. According to German researcher Thomas Münzel, after compiling previous research on noise pollution and heart health, he found that high levels of noise activate the sympathetic nervous system involved in the fight or flight response. As a result, this causes a steep increase in the stress hormone, cortisol (Figure 2), causing harm to the vascular system.

Figure 2 shows the structure of the stress hormone, cortisol. Source: Wikimedia Commons

Münzel and his team tested their claim by building animal models based on the result of exposing of mice to aircraft noise at a mean sound pressure level of 72 decibels for several days. Some of the factors they tested were systolic blood pressure and vasoconstriction, the constriction of blood vessels. According to Figure 3 and 4, as the number of days exposed to aircraft noise increased, systolic blood pressure as well as vasoconstriction in mice increased.

Figure 3 shows that as mice are exposed to aircraft noise for longer periods, their systolic blood pressure increases. Data obtained from paper.

Figure 4 shows that vasoconstriction in mice increases with the number of days they are exposed to aircraft noise. Data obtained from paper.

An increase in these symptoms associated with the vascular system can increase arterial stiffness and clog arteries. These results from mice can be extrapolated to humans to show that frequent exposure to loud noises cause symptoms that can lead to cardiovascular disease. Though not much can be done by the general public and doctors besides avoiding exposure to loud noises, Münzel believes that change is in the hands of the politicians to ensure new developments are taking place to reduce the noise level in cities.

-Annelie

References:

  1. Münzel, T.; Schmidt, F. P.; Steven, S.; Herzog, J.; Daiber, A.; Sørensen, M. Journal of the American College of Cardiology 2018, 71 (6), 688–697.
  2. Macmillan, A. Noise Pollution Increases Risk for Heart Disease http://time.com/5135279/noise-pollution-increases-heart-risk/ (accessed Mar 6, 2018).
  3. Bever, L. Why car horns, planes and sirens might be bad for your heart https://www.washingtonpost.com/news/to-your-health/wp/2018/02/06/why-car-horns-and-other-common-loud-noises-may-be-bad-for-your-heart/?utm_term=.407c72ef8392 (accessed Mar 6, 2018).
Image

Moose Population Analysis – Fewer Yearly Hunters

Animal populations change over time, such is a well-known fact. There are many factors contributing to cause a specie’s population to change, some of these natural and some man-made. Animal populations are often monitored over time and their habitats investigated to find the cause of the population change. Over a period of 28 years, from 1987 – 2014, moose population numbers were counted yearly along with the numbers of licensed hunters and hunter harvest estimates.

The graph below shows that the numbers of yearly hunters decreased over time. However, the population report states that moose populations remained relatively constant over time. This shows that the numbers of hunters does not have too large an effect on the moose populations, and to accurately model the change in moose populations, other factors must also be included, such as food availability, weather/climate, diseases, etc.

Reference: Kuzyk, Gerald W. “Provincial Population and Harvest Estimates of Moose in British Columbia.” Alces, vol. 52, 01/01/2016, pp. 1,

Link

Sea level acceleration over 25 years

The global mean sea level has been measured by satellite altimetry to be increasing by 3mm ±0.4mm per year, resulting in more than 7cm of total sea-level rise over the last 25 years. Steve Nerem and his colleagues showed that this rate is accelerating at 0.084 ± 0.025 mm/y2. At this rate, it is possible that in 2100 the sea level will rise 65cm. This can potentially cause problems for coastal cities.

Acceleration is mainly caused by the ice melting in Greenland and Antarctica, and the expansion of sea water due to warming by an increase in greenhouse gas concentrations. The U.S/European TOPEX/Poseidon, Jason-1, Jason-2, and Jason-3 satellite missions were used to measure these increases since 1992. However, detecting acceleration is difficult due to fluctuations caused by volcanic eruptions and errors of the instruments.


This data was obtained from the satellite altimeter record of Global Mean Sea Level over the last 25 years. An approximate 7cm of total sea level rise is seen from 1993-2017.

Temperature fluctuations between the ocean and atmosphere, known as El Niños and La Niñas, could also lead to sea level fluctuations. Therefore, Nerem and his colleagues used climate models to determine the opposing phases of the El Niños Southern Oscillation in order to find the sea level acceleration more accurately. They also examined the sea level difference between altimetry and tide gauges over time to find errors, such as instrument drift, in the altimeter measurements.

Co-author John Fasullo said the study is an important role for satellite records in validating climate model projections and interpreting satellite records, such as estimating the background effects of the 1991eruption of Mount Pinatubo on global sea level.

-Anita Wang


Reference:

Sea level rise accelerating: acceleration in 25-year satellite sea level record https://www.sciencedaily.com/releases/2018/02/180212150739.htm

R. S. Nerem, B. D. Beckley, J. T. Fasullo, B. D. Hamlington, D. Masters and G. T. Mitchum. Climate-change–driven accelerated sea-level rise detected in the altimeter eraPNAS, 2018

Cool Clothing, Literally!

With no solution on how to reduce greenhouse gas emissions, the concept of personal thermal management is becoming a promising alternative to renewable energy resources. Personal thermal management focuses on cooling or heating the human body instead of an entire building. This is the most cost-effective way to solve the energy dilemma.

A team of researchers at Stanford University have found one way of reducing energy consumption by demonstrating the use of nanoporous polyethylene (nanoPE) as a textile for human clothing. They predict that this fabric could reduce the amount of energy used for air conditioning.

A portion of heat from our bodies is released through the emission of IR radiation in the range of  7 – 14 nm. Many of the fabrics we wear have chemical groups that absorb radiation in that range. One fabric, Polyethylene, is transparent to IR but it is also transparent to visible light which is not desirable as it causes our bodies to increase in temperature.

Figure 1. The schematics of human body radiation, visible light and air convection. Source: Cui et al., 2016

However, Ci Yui and his colleagues at Stanford University hypothesized that if polyethylene had pores between 50 – 1000 nm in diameter then it could scatter visible light, making it opaque, but still allow IR to pass through. Fortunately, such a material already exists and is commercially available. Lithium-ion batteries use nanoPE as a separator between anodes and cathodes to prevent electrical shortages.

Figure 2. The total IR transmittance of bare skin, normal PE, nanoPE, cotton, Tyvek and PDA-nanoPE-mesh. Credit; Cui et al., 2016

Yui and his team used a device to simulate the heat output of skin and tested the cooling effects of nanoPE, cotton and Tyvek, a fibrous polyethylene textile manufactured by DuPont. They found that compared to cotton, nanoPE was able to cool bare skin by 2.7°C more. In addition, nanoPE was the only material of the three tested to reveal the H-shape, mimicking bare skin,  because of its IR transparency.

Figure 3. Thermal measurement nanoPE, cotton and Tyvek. (A) The device used to simulate the heat out put of skin. A thermocouple is used to measure temperature. (B) The thermal measurement of each material. (C) Thermal imaging of bare skin and the three materials tested. Source: Cui et al., 2016..

“That may not sound like much, but in terms of energy savings it actually could be huge”, says Svetlana Boriskina of Massachusetss Institute of Technology, who wrote on the Yui’s findings in Science. She points out that setting a home’s thermostat a few degrees lower can cut energy use up to 45%.

To make the material more appealing, Yui and his team coated the nanoPE to wick away moisture to keep the wearer feeling dry.” Yui and his colleagues may have demonstrated another function of nanoPE, but more research is needed to test for its comfort, durability and a way to colour the material with dyes that won’t block IR radiation.” adds Boriskina.

-Ashlea Ahmed

Resources:

Hsu, P.; Song, A.; Catrysse, P.; Liu, C.; Peng, Y.; Xie, J.; Fan, S.; Cui, Y. Radiative Human Body Cooling by Nanoporous Polyethylene Textile. Science [Online] 2016, 353, 1019-1023 http://science.sciencemag.org/content/sci/353/6303/1019.full.pdf (accessed Mar 4, 2018).

Scientific American. Newest Material Makes Coolest Clothing Around.https://www.scientificamerican.com/article/new-material-makes-coolest-clothing-around/ (accessed Mar 4, 2018).


Fingerprints Tell All: The Fastest Drug Detection Method

Cocaine is the second most illicit trafficked drug around the world, with a global production of 866 metric tonnes in 2016, and is currently on the rise in many regions of Europe. For current techniques to determine this illegal substance in a person’s system, specialists must conduct blood or urine testing procedures that require laboratory resources and long wait periods. However, in 2017 researchers at the University of Surrey proposed a method of taking fingerprint tests that can trace cocaine in the system within a matter of minutes.

Fig. 1: Cocaine in Powder Form Drawn into lines Source: Pixabay

Dr. Catia Costa, Dr. Melanie Bailey and their team took fingerprints from patients seeking rehabilitation. Fingerprints were analyzed using chromatography paper, a paper spray mass spectrometry technique, looking at concentrations of cocaine, benzoylegonine (BZE) and methylegonine (EME). Both substances are excreted from the fingertips when the body metabolizes the drug.

Cocaine is a highly addictive substance, derived from the South American coca plant, that inhibits the reuptake of serotonin, norepinephrine and dopamine. This results in higher concentrations of these neurotransmitters in the brain providing the user with increase levels of euphoria, energy and elevated mood. The drug is so potent that the metabolites can stay in the system for 2-4 days.

Fig. 2: Chemical Structure of Cocaine             Source: Wikimedia Commons

The paper is first prepared by applying a internal standard, spray solvent and then a voltage. After the fingerprint have been pressed, silver nitrate fingerprint development solution is added and exposed to ultraviolet light that will enhance black ridge fingerprint marks on the paper. Oral fluid results of cocaine had a detection limit of 1ng/mL. They found that 98.7% of the results gave a true positive while 2.5% gave a false positive with a single fingerprint.

Fig. 4: 12 Participants in the rehabilitation centre and the Amount of Cocaine found in their Oral Fluid Results

The oral fluid results were then compared with fingerprint analysis and the researchers found every finger except one gave positive results for one substance.

Fig. 5: 12 Participants (same from Fig. 4) and at least one substance (Cocaine, BZE, EME) detected on fingerprints

Law enforcement, prisons, courts, and drug rehabilitation centres can utilize this technique for a faster and more effective process of collecting drug. It takes 4 minutes per sample but research continues to look for faster techniques that can possibly take only a matter of seconds to develop in the near future.

– Tiffany Liew

References

Becue, A.; Moret, S.; Champod, C.; Margot, P. Use of stains to detect fingermarks. Biotech Histochem. 2011, 86, 140-160.

Costa, C.; Webb, R.; Palitsin, V.; Ismail, M.; dePuit M.; Atkinson, S.; Bailey M.J. Rapid, Secure Drug Testing Using Fingerprint Development and Paper Spray Mass Spectrometry. Clin. Chem. 2017, 11, 1745-1752.

Kuwayama, K.; Miyaguchi, H.; Yamamuro, T.; Tsujikawa, K.; Kanamori, T.; Iwata, Y.T.; Inoue, Hiroyuki. Effectiveness of saliva and fingerprints as alternative specimens to urine and blood in forensic drug testing. Drug Test. Analysis. 2016, 8, 644-651.

Mejia, D.; Posada, C.E. Cocaine Production and Trafficking: What Do We Know? World Bank Group. [Online] 2008, 4618 https://openknowledge.worldbank.org/handle/10986/6719 (accessed Mar 5, 2018).

Shen, L.; Zhang, J.; Yang, Q.; Manicke, N.E.; Ouyang, Z. High throughput paper spray mass spectrometry analysis. Clin. Chim. Acta. 2013, 420, 28-33.

Arctic Report Card: Unprecedented Decline in Arctic Sea Ice

The Arctic Ocean has been observed to reliably freeze every winter, however the rise in Arctic temperature just now caught up with the rate of ice forming in this region. This results in the most unprecedented transformation of the Arctic environment since the dawn of human civilization: It no longer freezes.

The latest Arctic Report, published by the National Oceanic and Atmospheric Administration (NOAA), shows that in recent years a warming trend persisted, showing “no sign of returning to reliably frozen region of recent past decades”. Scientists determined that the warming will continue to increase at double the rate of global temperature increase.

2017 saw a historical low for maximum sea ice extent. The Arctic experienced “the largest magnitude decline in sea ice, and the greatest sustained rate in sea ice decline in that 1,500-year record,” said Emily Osborne, a NOAA scientist, citing a study by Kinnard et al. This means that in recent years less and less of the Arctic ocean freezes during peak winter. This is shown in Figure 1.

Figure 1. Reconstruction of approximately 5-year mean sea ice extent (Kinnard et al., 2011) spanning the last 1,500 years

How does this look for 2018? Meteorologist Eric Holthaus said “the middle of February is the usual time of the annual low for the planet’s sea ice.” The National Snow & Ice Data Center (NSIDC) reported that current Arctic sea-ice extent is even lower than 2017 data, despite experiencing one of the coldest winters in recent years. This trend is shown in the graph below.

Figure 2 Data collected by NSIDC and NASA

Area is calculated from NSIDC sea ice concentration data, measuring a grid cell covered in sea ice of 15% concentration or more. As of now, the planet is covered in just under 16 million square kilometers of sea-ice, 1.36 million square kilometers below the 1981–2010 average:

Sea Ice Extent as of January 2018 (National Snow and Ice Data Center)

Jeremy Mathis, director of the Arctic Research Program for NOAA described his field research in the Arctic region:

“When I started going to the Arctic in 2003, it was a very different environment that it is today. Back in 2003, we were breaking ice everywhere we went, from pretty much starting in the Bering Strait moving all the way up into the study areas north of Alaska and into the central Arctic basin. There was ice that was very thick and it was very extensive. This year in 2017, during a 25-day cruise in the Arctic, we didn’t see a single piece of ice. We were sailing around on a coast guard icebreaker in blue water that could have been anywhere in the world. And it certainly didn’t look like the Arctic.”

CNN: Greenland, Summer 2017. Iceberg fragments floating off the coast.


The impact of this change will affect the entire world. As ice melts, less heat is reflected off from Earth’s surface. Sunlight entering the atmosphere will instead be absorbed by thinner darker ice, which accelerates the rate of ice melting even further.

Scientists are pessimistic for the future, observing no end for this trend in sight.


References

Beitler, J. (2018). Sea ice tracking low in both hemispheres | Arctic Sea Ice News and Analysis. [online] Nsidc.org. Available at: http://nsidc.org/arcticseaicenews/2018/02/sea-ice-tracking-low-in-both-hemispheres/ [Accessed 5 Mar. 2018].

CBC (2017). Arctic report card: Permafrost thawing, sea ice melting faster than before. [online] Available at: http://www.cbc.ca/news/canada/north/noaa-arctic-report-card-permafrost-thawing-1.4445222 [Accessed 5 Mar. 2018].

Kinnard, C., Zdanowicz, C., Fisher, D., Isaksson, E., de Vernal, A. and Thompson, L. (2011). Reconstructed changes in Arctic sea ice over the past 1,450 years. Nature, [online] 479(7374), pp.509-512. Available at: https://www.nature.com/articles/nature10581 [Accessed 5 Mar. 2018].

Smith-Spark, L. (2017). Warmer Arctic temperatures the ‘new normal’. [online] CNN. Available at: https://www.cnn.com/2017/12/13/world/arctic-report-climate-change-intl/index.html [Accessed 5 Mar. 2018].

J. Richter-Menge, J. E. Overland, J. T. Mathis, and E. Osborne, Eds., 2017: Arctic Report Card 2017, http://www.arctic.noaa.gov/Report-Card


Preschool Children Are Not Being Taught Enough Science

Young children are not being exposed enough to science. Photo: Ole Haug, flickr.com

A new study revealed preschool teachers in the US are not effectively teaching science to their young students, a problem that likely contributes to the country’s poor global performance in the subject.

Researchers from Michigan State University have shown that teacher’s engagement with science instruction in the classroom is much lower than literacy or math. In a paper recently published in the journal Early Education and Development, researchers found that early school teachers lack the knowledge, skills and confidence required to effectively teach science to young children.

The study shows that although 99% of preschool teachers studied will instruct literacy three to four times a week, the number drops to 75% for math and 42% for science. This is particularly concerning as American students were found to be behind other developed nations in terms of academic achievement in the sciences. Improving quality education in science at early stages of child development can be crucial to better academic results later on.

The graph below shows the disparity in frequency of teaching across literacy, science and math.

Frequency of teaching different subjects in preschool classrooms studied. Data from Gerde et al., 2017.

The teacher’s self-efficacy in each subject was also analysed. Self-efficacy is the teacher’s belief in their ability or competence in a certain subject. This is important as it has implications for teaching practices and learning outcomes. The study found that the teacher’s self-efficacy was highest for literacy, significantly lower for science, and lowest for math, indicating that the teacher’s perceived ability in a subject can be a barrier in teaching that subject.

The study also points out that teachers may feel pressured by policymakers and school administrators to focus on literacy development. This, combined with lack of science content and skills screening in kindergarten readiness, leads to teachers prioritising literacy to the point of almost excluding science in the classroom.

It is important to ensure that preschool teachers are qualified, confident, and well trained in scientific literacy. This will allow them to have all the necessary tools required to educate young minds to become critical thinkers from a very young age. However, policymakers and schools need to value scientific education more if these changes are to be effective.

– Ana Brunner

References:

BANDURA, ALBERT, 1982. Self-efficacy mechanism in human agency. American Psychologist. 37 (2): 122–147.

DESILVER, D., Feb 15, 2017-last update, U.S. students’ academic achievement still lags peers in many other countries [Homepage of ACI Information Group], [Online]. Available: http://scholar.aci.info/view/14bd17773a1000e0009/15a4407652e0001ba33aef2 [March 4, 2018].

GERDE, H.K., PIERCE, S.J., LEE, K. and VAN EGEREN, L.A., 2018. Early Childhood Educators’ Self-Efficacy in Science, Math, and Literacy Instruction and Science Practice in the Classroom. Early Education and Development, 29(1), pp. 70.

Photo by Ole Haug. flickr.com