Art and Graffiti in Vancouver
By Kelly Chim, Ece Kucukcolak, Riley Job
Wix: https://tabbypublic419.wixsite.com/info419artinvan
Objectives
Vancouver is a city that embraces and encourages art of all forms, but it also emphasises the maintenance of a “clean and natural” city. Thus, what about the more problematic, less recognised and formal artistic mediums? Graffiti.
Where does graffiti lie in the realm of public art?
The legal line between them is defined in the Vancouver bylaws; the two main factors distinguishing it from public art is permission and the property it is on (City Of Vancouver, n.d.). In the past few years, there has been an effort from local graffiti artists to remedy the vandalism problem by advocating for sanctioned graffiti zones (Diment, 2022). In addition, property owners have been open to graffiti murals being painted on their walls as a method of deterring taggers. However, is graffiti culture evolving into a recognised art form, or is it merely a part of city gentrification? Sabina Andron, an expert in urban visual culture, proposes that graffiti are cultural markers that encompass “an urban discourse about plurality and participation, about public space as commons instead of regulated visual space” (2023). Graffiti has value in more than just a nuisance but further in community members trying to establish their vision for their physical spaces.
Our goal is to analyse the locations (neighbourhoods) in which past and present graffiti and public art are most prevalent, in an attempt to reveal any patterns or trends that may exist, such as whether certain neighbourhoods have a high percentage of both or if the two do not consistently co-exist in the same areas. Our intended audience is Vancouverites who are concerned with community aesthetics and art. What we want to do with these visualizations is collate this discourse into a format that is easily accessible and can be understood by a wide audience to facilitate an important discussion about communal spaces. We want to tell the story about the interaction of formal and non-formal art forms and the way that they interact in Vancouver, a city known for art.
Data Set(s) Used
We downloaded the graffiti and public art data sets from Vancouver’s Open Data Portal and cleaned it. We also downloaded the local area boundary data set from the same site. As we currently live in Vancouver, we wanted to choose data that was relevant to our local area as a way to gain a deeper understanding of our community.
Tools Used
We uploaded our data onto a shared Google Sheets, which allowed us to work from and clean the data together to ensure that it was thorough. We matched neighbourhood names across both data sets, as well as filled in cells that were missing information, such as location coordinates. To accomplish this, we relied on Google Maps to visually search for the art and then copied the coordinates onto Sheets. This was helpful in finding most of them, but did not work specifically for art that also served as public infrastructure such as painted benches, engraved manhole covers or advertisements and posters that had multiple undisclosed locations. Thus, we deleted several cells where the artwork’s locations were difficult to pinpoint or scattered across a stretch of land as there was no proper documentation about their locations. We also realised later that to upload custom coordinates in Tableau, latitude and longitude had to have their own columns, so we separated them accordingly as the datasets had them combined into one column. When we were finished, we exported the Sheets as an Excel file. We decided to keep the Graffiti and City Art data sets separate as the Graffiti sheet had substantially fewer different types of information than the city art sheet.
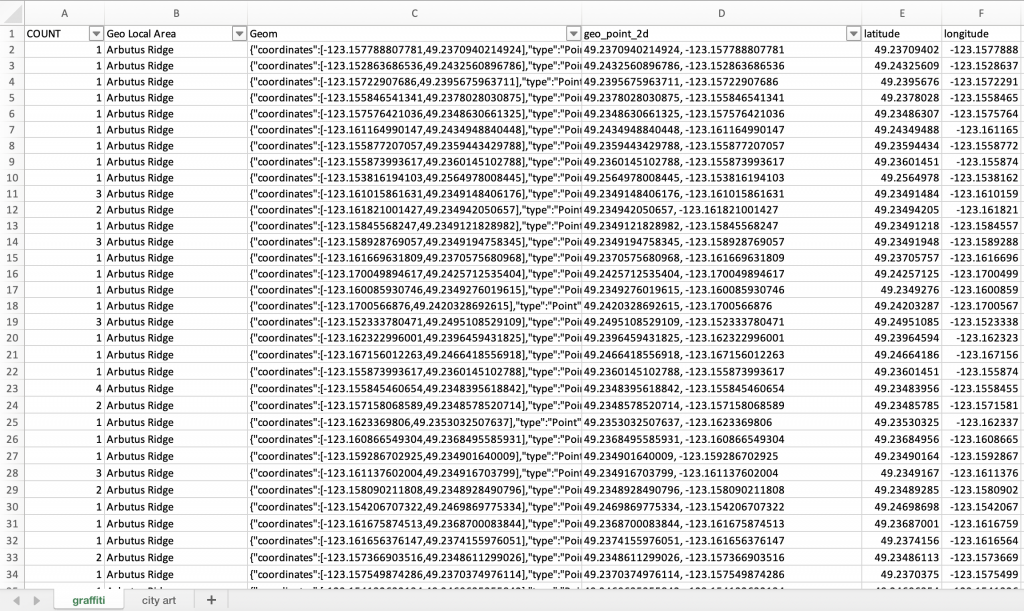
Fig 1. Graffiti Data Set (Excel) |
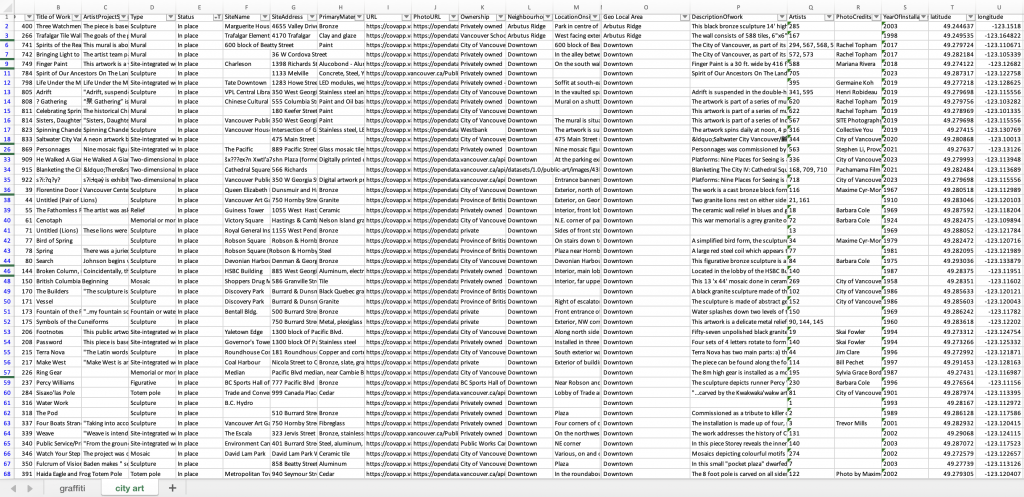
Fig 2. City Art Data Set (Excel) |
Following this, we brainstormed a couple of ideas for the visualisations.
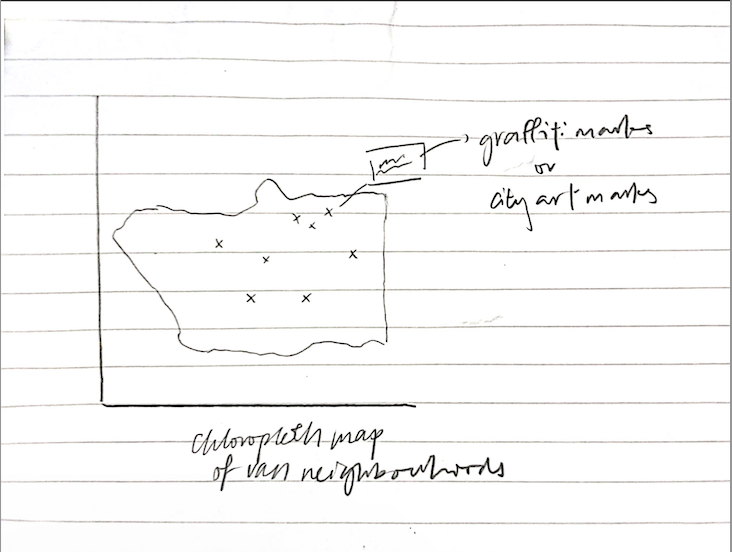
Fig 3. Brainstorming Sketch |
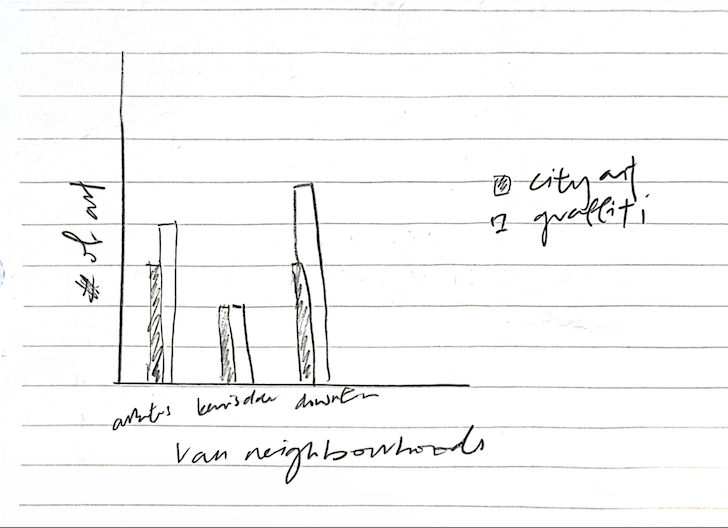
Fig 4. Brainstorming Sketch 2 |
After this, we ingested the data in Tableau. We used the software to assign our custom coordinate fields with “latitude” and “longitude” geographic roles to help plot these points on the map. To create our visualisations on Tableau, we referred to previous class exercises, online videos, discussion forums, and also had the professor’s help to guide us in the process of visualising our ideas. It was especially useful in helping assign the right attributes across multiple data sets, as well as helping us layer maps to show different attributes. Tableau, despite being a more difficult software, was suitable for our project because of the skills we had learned in class already and was useful in visualising large amounts of data.
We then used Wix to create our story for the final submission. It allows us to include embeds of Tableau graphs, and also has many graphics and text options for us to create an engaging story on a platform that’s relatively easy to navigate.
Analytic Steps
From our research about the graffiti art scene we determined that the existing view on Graffiti in Vancouver is mixed due to inconsistent municipal funding, public dislike of tagging but positive towards legal communal murals and had a successful community group, the Vancouver Coalition of Graffiti Writers, before its shut down in response to mayor Ken Sim’s new anti-graffiti policies in 2022 (Kozelj, 2022; Robinson, 2021). As there are such wide ranges of opinion and legality surrounding the graffiti scene we wanted to tell a story that invokes critical thinking from the audience, rather than in a persuasive narrative format.
We were pretty certain of the idea we wanted to communicate from the start, as seen in the Figure 3 sketch, but were unsure of the type of graphs we would discover as a result of our data. As out topic considers the geo-spatial location of graffiti and city art we wanted to ensure that locational data was the focus throughout our slides and visualizations. We conducted a few visual explorations of the geographical data to determine which graphs convey information in an aesthetic and clean way.
Figure 5 below shows one of our first drafts where we split the graph into two; both illustrated the number of graffiti in each neighbourhood (as shaded regions and as a density map). We followed effectiveness in choosing to utilize luminance to codify region as position, length, tilt and area were already being utilized to define different neighbourhood boundaries and land formations in the above visualization (Munzner, 2015). However, as spatial position is so expressive we wanted to ensure that it was being utilized in the density map to show exactly where the incidents occurred by using circular marks. The use of luminance in showing density also is a great avenue for this visualization due to humans’ increased sensitivity to spatially arranged data when encoded by luminance (Ware, 2008). However, we decided to improve on this visualization by combining them into one unified map later on for a clearer comparison.
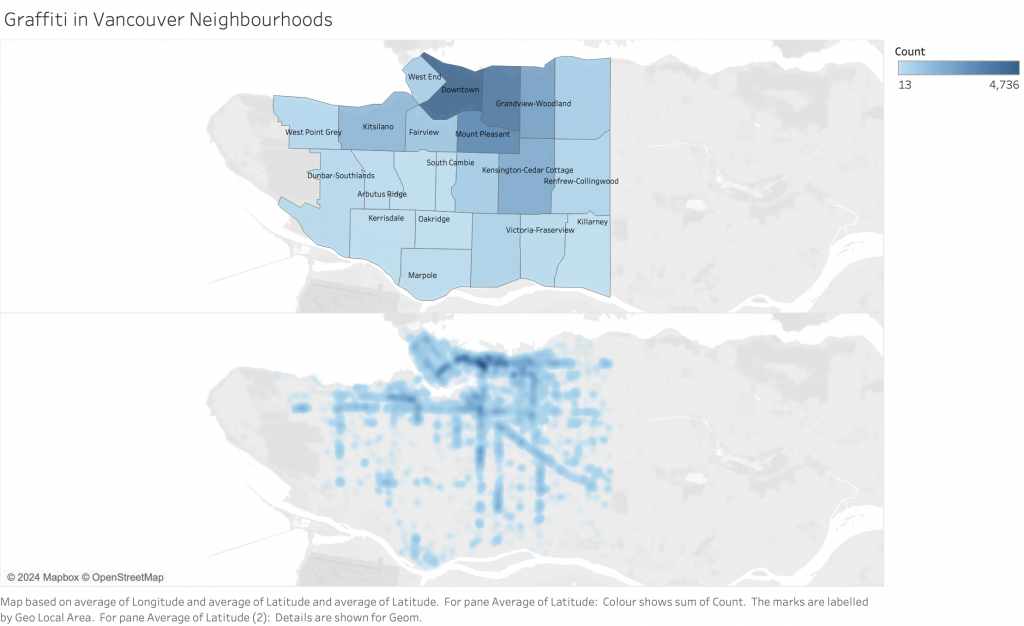
Fig 5. Draft of Graffiti in Vancouver Neighbourhoods (Tableau)
Figure 6 below is another one of our drafts where we used a labelled, stacked bar graph to demonstrate the contrast between the number of graffiti versus the number of city art in each local neighbourhood. However, we found that it was not useful to compare the relative compositions of art in each neighbourhood because the varying heights complicated the comparison between the two categories. Thus, we decided to move away from the stacked bar chart method and instead used a grouped bar chart as seen in Figure 9.

Fig 6. Draft of Graffiti VS City Art in Vancouver Neighbourhoods (Tableau)
Design Process
Basing the graffiti map on Figures 3 and 5, we first worked on layering the data sets with a choropleth map and symbol map for graffiti found in local neighbourhoods: both deal with graffiti in different ways, the choropleth map makes use of luminance (saturation) to visualise each neighbourhood’s graffiti count while the symbol map overlays the exact graffiti locations onto the map with circular marks (Figure 7). As such, no other data type was introduced in this visualisation, following the expressiveness principle. To contrast against the blue stepped colours of the choropleth map, an orange hue was used for the symbol map, increasing the marks’ saliency. Thus, the most important attribute of graffiti location was expressed through position and hue, following the effectiveness principle.
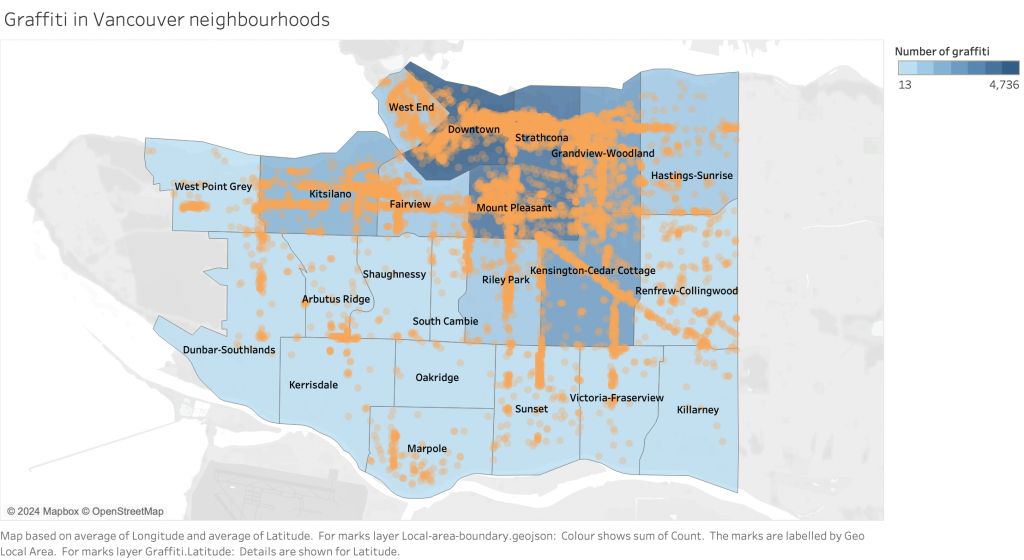
Fig 7. Graffiti in Vancouver Neighbourhoods (Tableau)
We repeated the method used to create the graffiti map for the city art one, but also included more details about the art as well that can be viewed if hovered over (Figure 8). These interactive elements were included as we thought it would be helpful to include pictures and descriptions of the artwork, but did not want to overcrowd the visualization with (unnecessary) information, thus, following the expressiveness principle. In terms of the hue choice for these maps, although we kept the same blue stepped gradient for the chloropleth map as in Figure 7, we decided to choose a lighter, less-contrasting purple hue for the city art marks. This is because we wanted to juxtapose the city art map with the graffiti map. Additionally, as orange and blue are complementary colours, whereas purple and blue are analogous, it plays into the metaphor that people believe city art (purple) belongs in the city while graffiti (orange) does not. Hence, although we did not strictly maintain effectiveness with hues in this visualisation, it still comes across with the geographical positions of the city art.
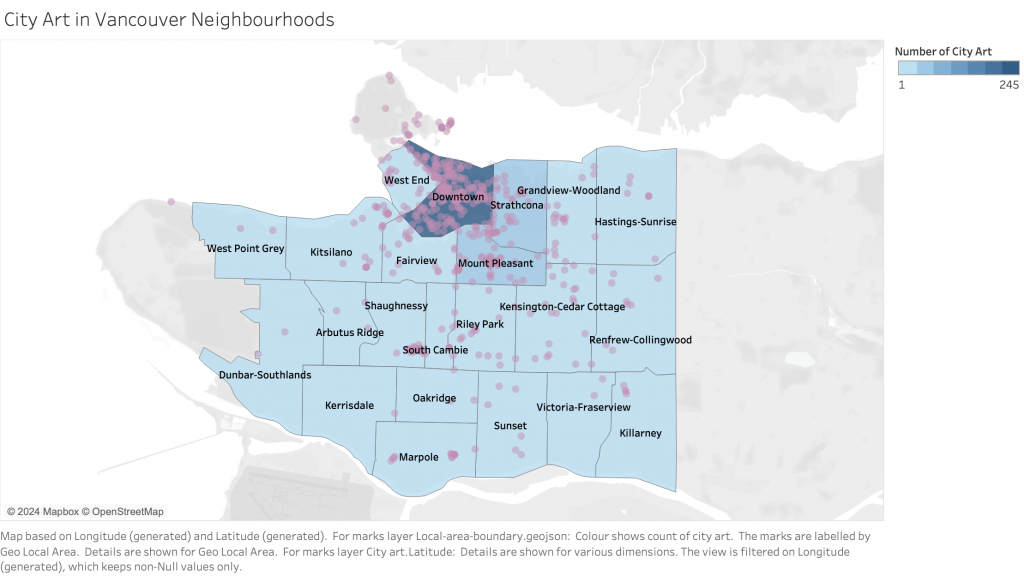
Fig 8. City Art in Vancouver Neighbourhoods (Tableau)
The visualisation in Figure 9 is a grouped bar chart that compares the graffiti count and the city art count for each neighbourhood in a simple manner, as well as makes use of an interactive highlight feature (seen in Fig 10) to allow users to spotlight or find a specific neighbourhood quickly and easily. To be consistent, we chose to use the same colours for the “graffiti” and “city art” measures as they were used previously in Figures 7 and 8. Additionally, the visualisation uses an identity channel and is organised alphabetically by neighbourhood, following the expressiveness principle.
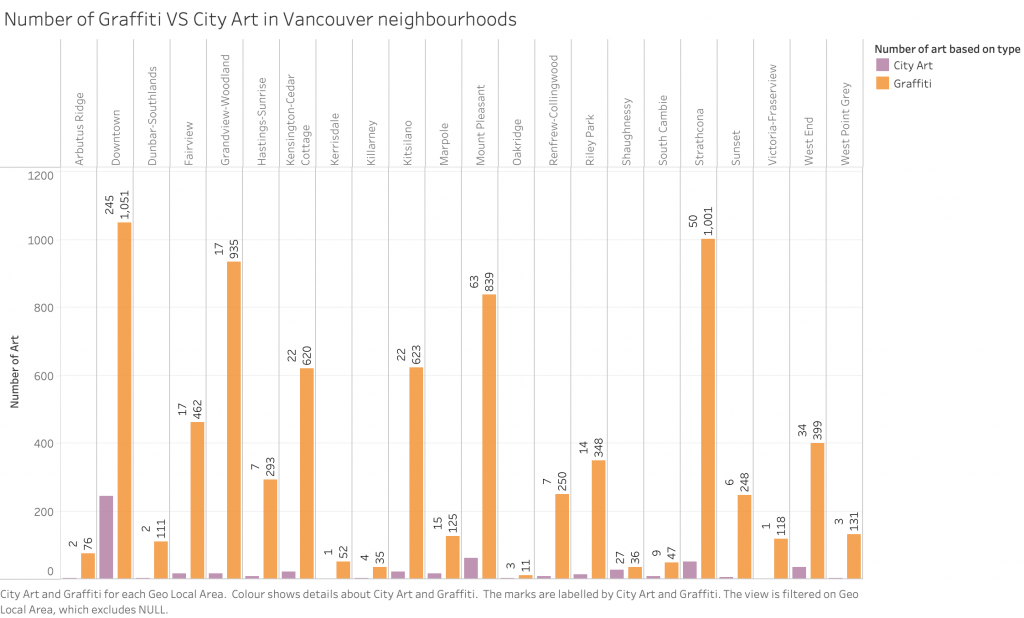
Fig 9. Number of Graffiti VS City Art in Vancouver Neighbourhoods (Tableau) |
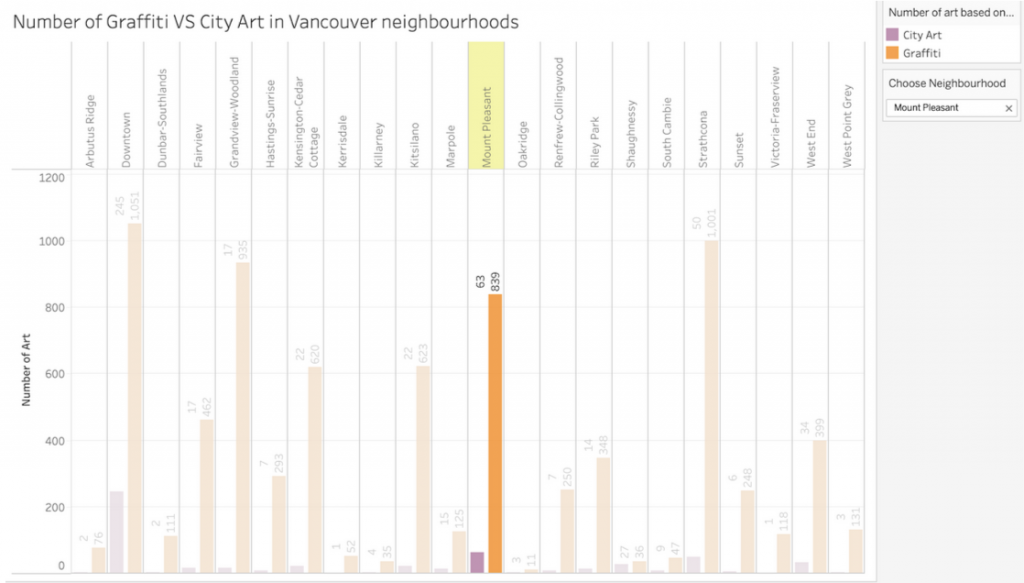
Fig 10. Interactive Element: Number of Graffiti VS City Art in Vancouver Neighbourhoods (Tableau) |
Figure 11 looks at a different visualisation altogether, focusing on the type of city art that exists within Vancouver. We decided to arrange it by increasing values for the number of art per city art type rather than alphabetical order because we believe the focus should be on which city art type is most prevalent, thereby following the effectiveness principle. The expressiveness principle is also taken into account as only the relevant information is shown in the visualisation, keeping the graph clean and easily understood by viewers.
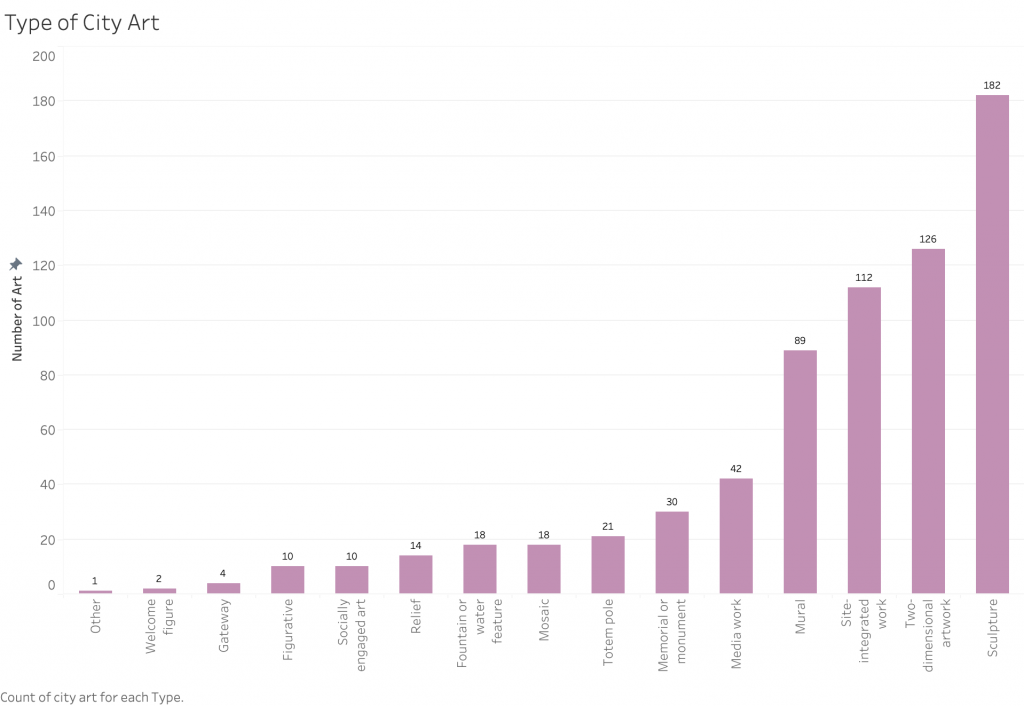
Fig 11. Types of City Art in Vancouver (Tableau)
The Story
After finishing the visualizations, we planned to use Canva for our presentation. However, we discovered that Canva did not support embedding our graphs, so we switched to Wix. Wix allowed us to embed the visualizations and include interactive elements.
Our project focused on analyzing the dynamics of graffiti and public art within Vancouver’s urban landscape. We identified areas where these art forms are most common; in some neighborhoods, there is more of a coexistence, and in others, a scarcity. We wanted to create a discussion on public spaces and the transformation of graffiti from vandalism to a recognized art form. We examine how it either integrates with or conflicts with the city’s design.
Pros and Cons
Pros: We used geographical maps and bar graphs to help us present the distribution and volume of graffiti and public art across Vancouver in an easily understandable way. This approach makes the data accessible and interpretable to a broad audience, which creates a compelling visual story.
Furthermore, we incorporated interactive elements like hover-over details in Tableau to improve the user experience. This feature allows the users to engage and explore specific artworks or graffiti which gives them more context. Displaying graffiti and public art data side by side, we created a comparative analysis. This helps to show the audience the frequency and acceptance of these art forms in different neighbourhood’s.
Cons: Our analysis is limited by the available data sets, therefore it may not fully capture the amount and exact location of graffiti and public art. This limitation could lead to potential biases or gaps in our analysis which can affect the overall narrative and conclusions that we came up with. The design choices and story structure in our project could impact audience opinion and influence whether graffiti is viewed more positively or negatively. This could affect the objectivity of our analysis and the message we intend to convey. We tried to make our project as accessible as possible, there’s a risk of oversimplifying the complicated relationship between graffiti, public art, and Vancouver’s landscape. This could mean overlooking deeper narratives and biases.
Bibliography
Andron, S. (2024). Urban surfaces, graffiti, and the right to the city. Routledge.
Andron, S. (2023). Urban Surfaces, Graffiti, and the Right to the City (1st ed.). Routledge. https://doi.org/10.4324/9781003456070
CBC/Radio Canada. (2017, February 24). POV | 21 of my friends died from fentanyl overdoses, now I paint murals to stop others | CBC Radio. CBCnews. https://www.cbc.ca/radio/nowornever/how-to-unleash-your-inner-artist-1.3995740/pov-21-of-my-friends-died-from-fentanyl-overdoses-now-i-paint-murals-to-stop-others-1.3997737
City Of Vancouver. (n.d.). Graffiti By-law 7343. Vancouver. https://vancouver.ca/your-government/graffiti-bylaw.aspx
Diment, M. (2022). Vancouver now has its first legal ‘graffiti wall’ and more could be in the works. Vancouver is Awesome. https://www.vancouverisawesome.com/local-news/first-legal-graffiti-wall-alley-tagging-vancouver-bc-5707660#google_vignette
Kozelj, J. (2022). Vancouver’s So Nice. Where’s the Graffiti?. The Tyee. https://thetyee.ca/News/2022/11/22/Vancouver-So-Nice-Where-Graffiti/
Kulkarni, A. (2024, January 15). Vancouver art students to learn about graffiti from one of the city’s Masters | CBC News. CBCnews. https://www.cbc.ca/news/canada/british-columbia/smokey-d-art-class-1.7083674
Robinson, K. (2021). Vancouver sees 70% spike in nuisance graffiti reports to 311 during COVID-19 pandemic. Global News. https://globalnews.ca/news/8240692/vancouver-spike-nuisance-graffiti-calls-311-covid-19-pandemic/
Smith, S. (2014). Forty Years of the Cadillac Ranch. Texas Monthly. https://www.texasmonthly.com/travel/forty-years-of-the-cadillac-ranch/
Images
Top-Calligrapher-266. (2022). Vancouver, BC – Graffiti.
https://www.reddit.com/r/Graffiti/comments/w65h34/vancouver_bc_graffiti/
Walker, J. (2010). vancouver: the almost perfect grid. https://humantransit.org/2010/02/vancouver-the-almost-perfect-grid.html
Jane Diokpo: Your report about graffiti and public art in Vancouver is well-organized and easy to follow. It explains the goals, where the data came from, the tools used, and how the visualizations were created. You also share insights about the graffiti scene in Vancouver and your process of analyzing the data.
You do a good job of comparing graffiti and public art in different neighborhoods using maps and bar graphs. The interactive features, like hover-over details, make the visualizations more engaging.
However, it might be helpful to explore the topic more deeply to avoid oversimplifying things. Also, making sure to represent different perspectives could make the analysis more fair and balanced.
Overall, your report presents the findings clearly and encourages readers to think critically about the relationship between art and public spaces in Vancouver.
Madison Stiver:
Hi guys, good job on your report! I think something that you did really well was all of the visualizations, especially the map, it looked really good. Since this is a report about art, it was a smart move to put other images in your report, rather than just the visualizations. One thing that you maybe could have improved on in your report is having more concise writing. I liked that you included in-text citations, but it sometimes felt like a lot. In-text citations are great to prove a point but I just feel that the paragraphs were sometimes quite lengthy. If you want to further explore this topic outside of this class, I think it would be really cool if you were to create an interactive map showing all the information you found on where artworks and graffiti are in and around Vancouver! Good job overall!
Hello guys! The report is very interesting, and it poses very relevant questions to the development of art and the development of cities. The images used kept the website engaging, as the viewer is reminded of the many art pieces we see in our everyday lives living in Vancouver.
The writing was very sensitive to the topic as you all acknowledge the issues with categorizing graffiti as a “non-art form”. It was also interesting to see that areas such as Mount Pleasant and Stratcona, were also along the top areas for graffiti, and the conclusion you have all come up with in those being areas that might be more accepting of graffiti as a form of art and cultural expression.
The graphs used to map where art and graffiti in Vancouver were very interesting, especially as you guys have used hue to map areas of high concentration. However, they could’ve been easier to navigate if the graph allowed one to drag around the map, without the need of zooming in and out.