
Lab 4 was focussed on carrying out a Spatial Analysis of Crime Incidents in the Ottawa Nepean Region 2005-2006 using Crime Stat.
The analysis required the use of Crime Stat to analyze the spatial distribution in the Ottawa Nepean area for crime incidents between January 2005 and March 2006. The data was retrieved from the Ottawa Police Department, Statistics Canada, and DMTI. The various analyses below aimed to process, analyze and visualize spatial distribution, clustering and/or hot spots of different crimes across the study of area. The outputs that can be useful in designing and targeting policy making in regards to crime reduction and analysis.
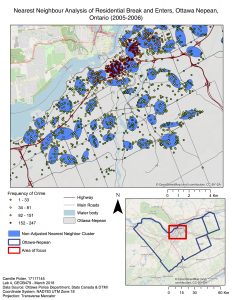
What is the Nearest Neighbour Index?
The nearest neighbor index is a distance statistics that is a test for first order nearest neighbor randomness. It compares the distances between nearest points and the distance that would be expected from chance. If the observed average distance is similar to that of the mean random distance, the ratio will be close to 1. However, if the observed average distance is smaller than the mean random distance, this means that points are closer together than would be expected from change, and the index will be less than 1.0. A value lower than 1.0 would therefore be an indicator of spatial clustering and spatial aggregation; The lower the index the more spatial aggregation. On the other hand, dispersal would be observed with an index above 1.
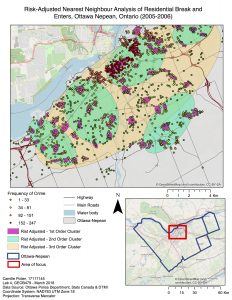
Standard versus Risk Adjusted Nearest Neighbour Analysis
The nearest neighbor hierarchical spatial clustering results showed clusters of crime across Ottawa. However, those results did not take into account the population of the areas. Taking into account for the population is relevant if wanting to analyze the relative risks of different areas. Indeed, areas with less population and high crimes are considered more dangerous than another area with the same number of crime but with much higher population.
The risk-adjusted nearest neighbor analysis portrays, as can be observed on the following page, the areas in Ottawa that have the higher risk of crime occurrence of residential break and enter. There are three different orders of clusters. The first order cluster which can be compared to the previous map for non- adjusted nearest neighbors clusters. It is possible to observe that their clusters are different due to the fact that population has been taken into account. In addition, there is also a second order clusters and third order clusters, which are clusters of clusters. The third order cluster results in one single cluster whereby all incidents fall within that cluster.
A copy of the lab, with a complete analysis and a discussion of Moran’s I and of the Fuzzy mode can be seen by clicking on the following link: Lab4.