
Lab 2 focussed on constructing and developing an “Assessment of Land Use Changes in Edmonton, Alberta, Canada Between 1966 and 1976 with a focus on Urbanization changes. The lab included a GIS spatial analysis requiring the use of Fragstats metrics and ArcMap. Through this lab, we learned how to create a transition matrix in order to assess the transformation of land uses over time. The final report was written from the perspective of a consultant.
For the report and analysis, I decided to focus on assessing the development of urbanization in the city’s landscape and to look at how that had potentially impacted other land uses, most especailly croplands. The report, constructed for the city of Edmonton, made some recommendations regarding the development of urban areas and on their relation to nearby land used for other purposes.
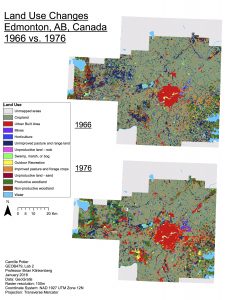
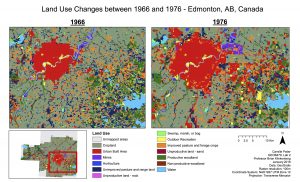
Indeed, between 1966 and 1976 the city of Edmonton has experienced significant land use change in its landscape. Urban built areas observed a 181% increase in land use, reflected by an increase of 354 Kilometers squared in total area. The composition of urban areas in 1976 was found to be 38,9% diverted from previous croplands and 13,5% from unimproved pasture and rangeland. Only 70% of urban areas fell within the urban built core area with edges of 100m, implying that 30% are in close proximity to potential harmful side effects of other land uses. This report brings forth the necessity to assess the potential consequences of land use types, such as mining, on urban areas. Although the landscape is found to be relatively diverse and even, it could be of interest to select zones where diversity is low to reduce the number of potential neighbors for urban developments, and therefore to reduce the probability of negative externalities impacting non-core area of urbanized locations. Finally, using spatial statistics it was found that the shape/size of croplands was also found to be vulnerable, and it could be in the city’s power to protect those small croplands and farmlands to support the local economy, and ensure future urbanization developments do not eradicate such areas.
By using ArcGIS and Fragstats it was possible to extract spatial statistics regarding land use changes between 1966 and 1976 (Appendix A and B). It was also possible to map such changes into 3 separate maps (Appendix C) which easily portray the expansion of Edmonton’s urban areas. In fact, Map 1 (Appendix C) represents effectively the overall land use changes experienced between 1966 and 1976. By integrating analyses and data from both ArcGIS and Fragstats it was eventually possible to create a transition matrix which mad it is possible to see the evolution and conversion of different land use classes between 1966 and 1976.
The final recommendation arising from the analysis was the following:
Through 1966 to 1976 the city of Edmonton seems to have developed its urban areas in such a way that has increased diversity and evenness across the landscape. Nevertheless, 30% of urban areas remain outside the core areas and are therefore susceptible to negative externalities from other neighboring land uses. It is critical for future urban developments to ideally be developed in areas where the diversity of neighborhood be reduced – yet like mentioned before the evenness and diversity of the landscape may pose problems when deciding on future urban developments. A recommendation could be to assess which land use classes has the less impact on urban areas. Moreover, the creation and establishment of regulations should be crucial in the areas around the core, and reducing the number of neighboring classes could be of interest – or avoiding certain land use types. In addition, the analysis has pointed out the vulnerability of small thin croplands. This could require the intervention of the city, in the long run, to protect these areas and support smaller farms; for instance, to ensure that urbanization developments do not have negative impacts on the local economy.
A copy of the full report can be accessed in the link below: