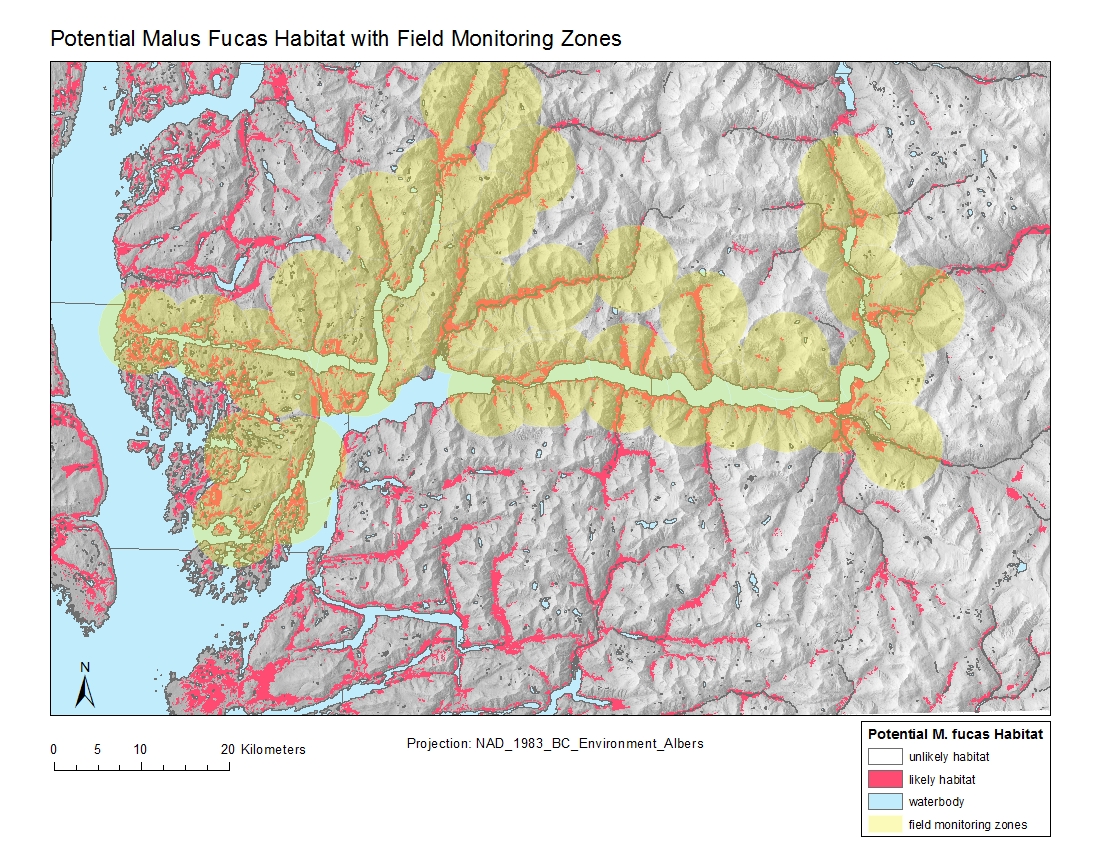
This image depicts (in pink) the initial weighted sum of elevation, aspect, slope and soil nutrients categorized to represent the top 50% of likely M. fusca habitiat. The areas in yellow represent the constraints of the proposed monitoring project, as they are close in proximity to bear monitoring sites and therefore candidates for M. fusca monitoring. As can be seen in this final map, each of the bear monitoring zones include potential M.fucas sites. The specificity of accessing the sites will depend on environmental factors (i.e boat access) and is beyond the scope of this GIS analysis.

Potential habitat for Malus fusca in Wuikinuxv Territory
GIS analysis to find Malus fusca habitat in Wuikinuxv Territory