Generalized Linear Regression:
The results of the GLR are global, meaning that they evaluate the city of Toronto in its entirety and do not evaluate the relationship between the crime variables and police stations and community housing units on the neighbourhood level.
Break and Enters:
- Police Stations
- P-value = 0.000000
- Coefficient = -0.211616
- Community Housing
- P-Value = 0.000000
- Coefficient = 0.002690
The results of the GLR show that a relationship between break and enters and police stations and community housing exists. This relationship is statistically significant in both cases, as the p values are 0.000. This means that there is a less than 1% chance that this relationship is due to pure chance. Regarding the relationship with police stations, break and enters decreased by 0.21, with the increase of one police station. This represents a slight decrease in break and enters with the inclusion of an additional police station. When considering the relationship of community housing and break and enters, break and enters increase by 0.003 with the increase of one community housing unit. This means that there is a marginal effect that community housing units have on break and enters.
Homicides:
- Police Stations
- P-value = 0.319572
- Coefficient = 0.283352
- Community Housing
- P-Value = 0.000000
- Coefficient = 0.013862
The relationship between police stations and homicides is not statistically significant as the p-value is 0.32, meaning that there is a 32% chance that the relationship observed between homicides and police stations is due to pure chance. On the contrary, the relationship between community housing and homicides is statistically significant, as the p-value is 0.000, indicating that the likelihood that the relationship observed is due to chance is less than 1%. The relationship observed was that homicides increased by 0.014, with the increase of one community housing unit. This relationship shows the marginal nature of community housing units on homicides as the increase in one community housing unit results in a marginal increase in homicides.
Assaults:
- Police Stations
- P-value = 0.000000
- Coefficient = -0.310055
- Community Housing
- P-Value = 0.000000
- Coefficient = 0.005228
The relationships between police stations and assaults, as well as community housing and assaults, are statistically significant due to the p-value being 0.000, thus signifying a less than 1% chance that the relationships observed are due to chance. An increase in police stations by one results in decreased numbers of assaults by 0.31, while an increase of community housing units by one results in an increase in assaults by 0.005. This shows a slight decrease in assaults with the creation of an additional police station. Simultaneously, there is a marginal increase in assaults with the increase of additional community housing locations.
Spatial Autocorrelation:
Homicides:
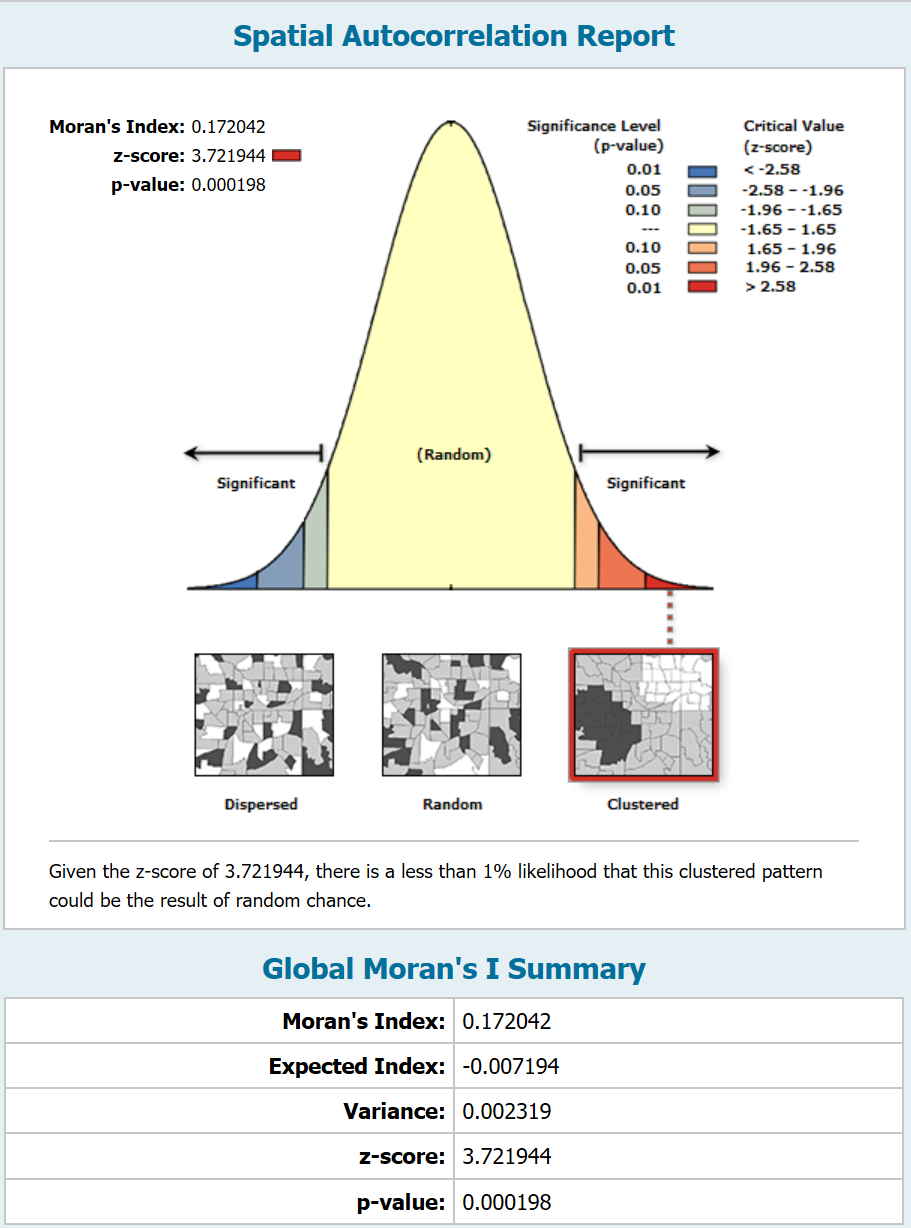
The report generated by the Spatial Autocorrelation tool indicated that the expected index is -0.007194, which means that there should not be a positive correlation between the locations of values. However, Moran’s Index is 0.172042, meaning that there is spatial autocorrelation observed. This means that the presence of homicides is clustered. As the z -score is above 2.58, there is clear evidence of clustering of homicides. Coupled with the fact that the p-value is 0.000198, this means that the likelihood that this relationship is due to pure chance is less than 2 out of 10000.
Break and Enter:
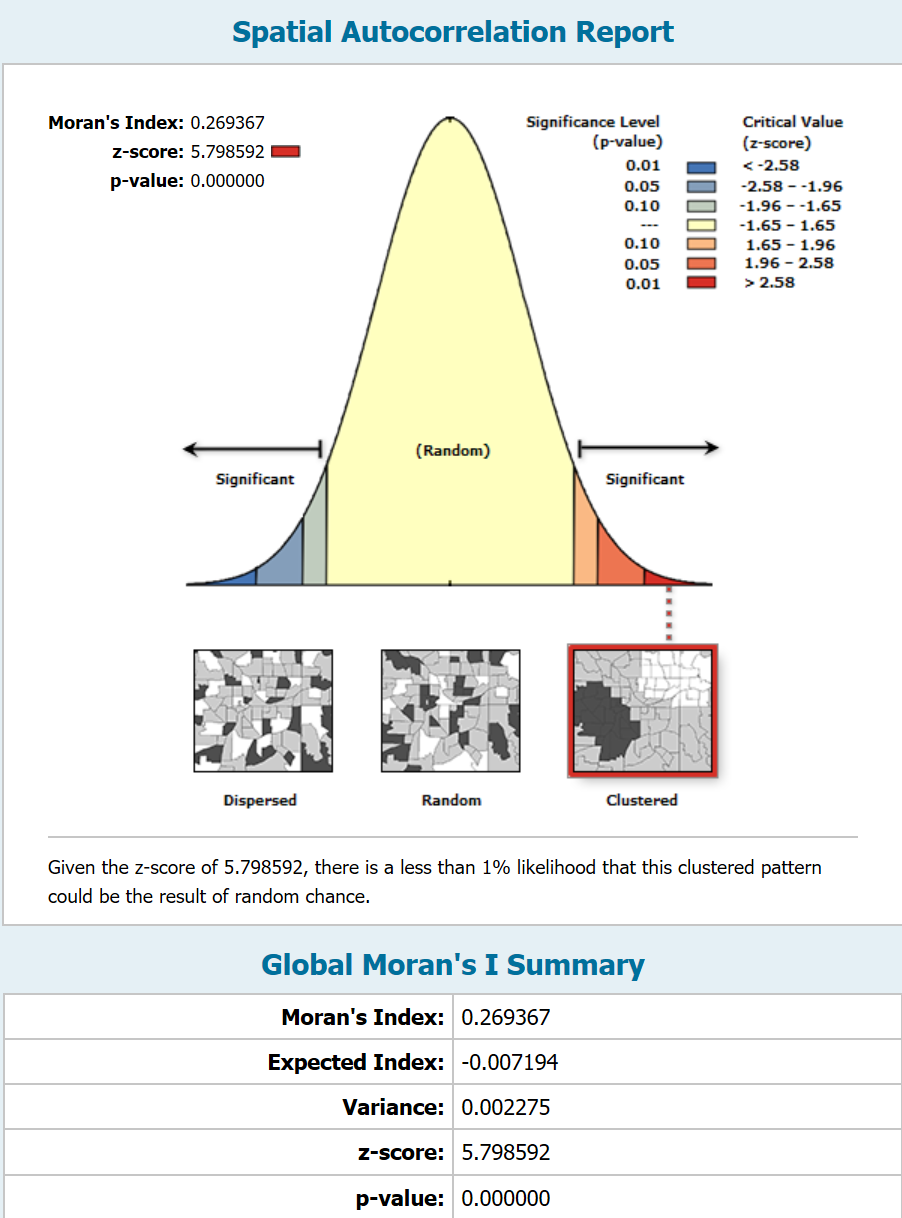
The report generated by the Spatial Autocorrelation tool indicated that the expected index is -0.007194, which means that there should not be a positive correlation between the locations of values. However, Moran’s Index is 0.269367, meaning that there is spatial autocorrelation observed. This means that the presence of break and enters is clustered. The z -score is above 2.58, which confirms this. Coupled with the fact that the p-value is 0.000000, this means that the likelihood that this relationship is due to pure chance is much smaller than 1%.
Assaults:

The report generated by the Spatial Autocorrelation tool indicated that the expected index is -0.007194, which means that there should not be a positive correlation between the locations of values. However, Moran’s Index is 0.257861, meaning that there is spatial autocorrelation observed. This means that the presence of assaults is clustered. As the z -score is above 2.58, there is clear evidence of clustering of homicides. The p-value is 0.000000, which means that the likelihood that this relationship is due to pure chance is much smaller than 1%.
Hot Spot Analysis
Assaults:
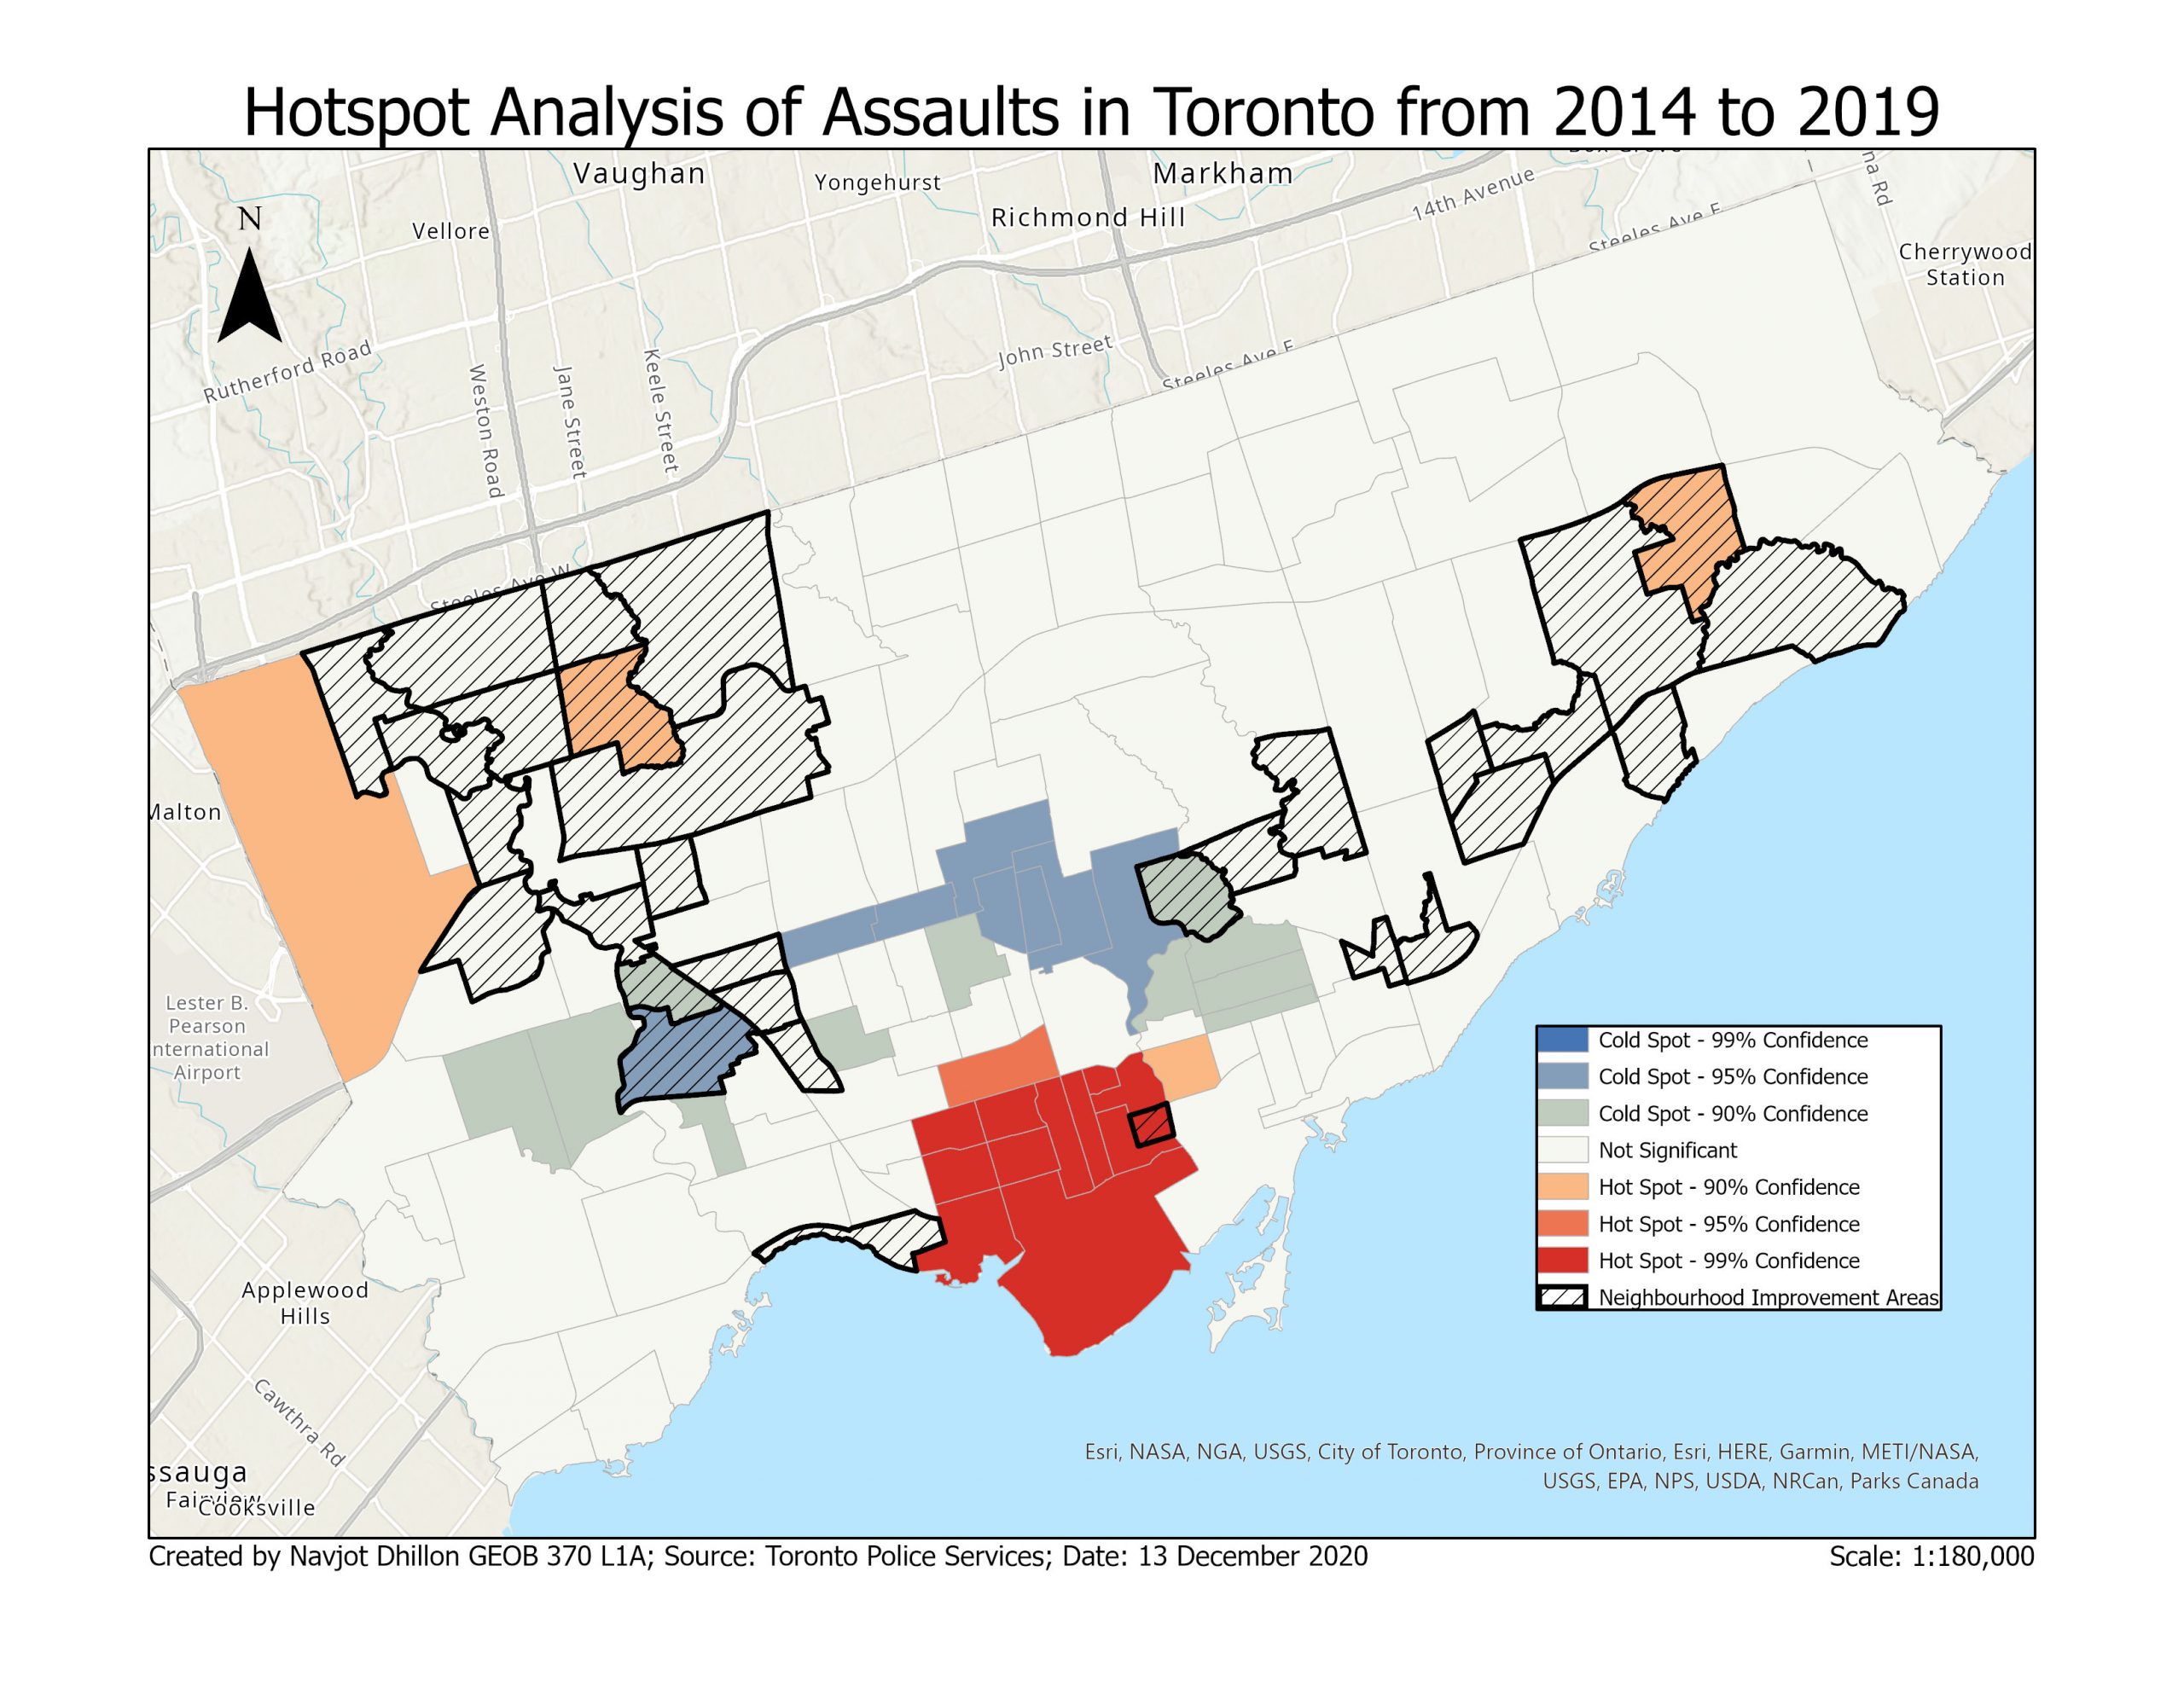
This hotspot analysis indicates areas that have a high clustering of assaults that are statistically significant. The neighbourhoods coloured in dark red state that there is a high level of clustering, as the z score in these areas is above 2.58. This z score is statistically significant, as the p-values are below 0.05. There are also cold spots, which are areas that have a strong negative z score while being statistically significant. These cold spots are areas where assaults are not clustered, but instead, they are dispersed. The neighbourhoods deemed to be in need of improvements are also indicated on this map.
The majority of neighbourhoods that show the strongest evidence of significant clustering of assaults is located around the downtown area of Toronto. Only one of these neighbourhoods has been classified as a Neighbourhood Improvement Area. The neighbourhoods that are cold spots are located just north of the downtown area, and some of them are classified as Neighbourhood Improvement Areas.
Break and Enters:
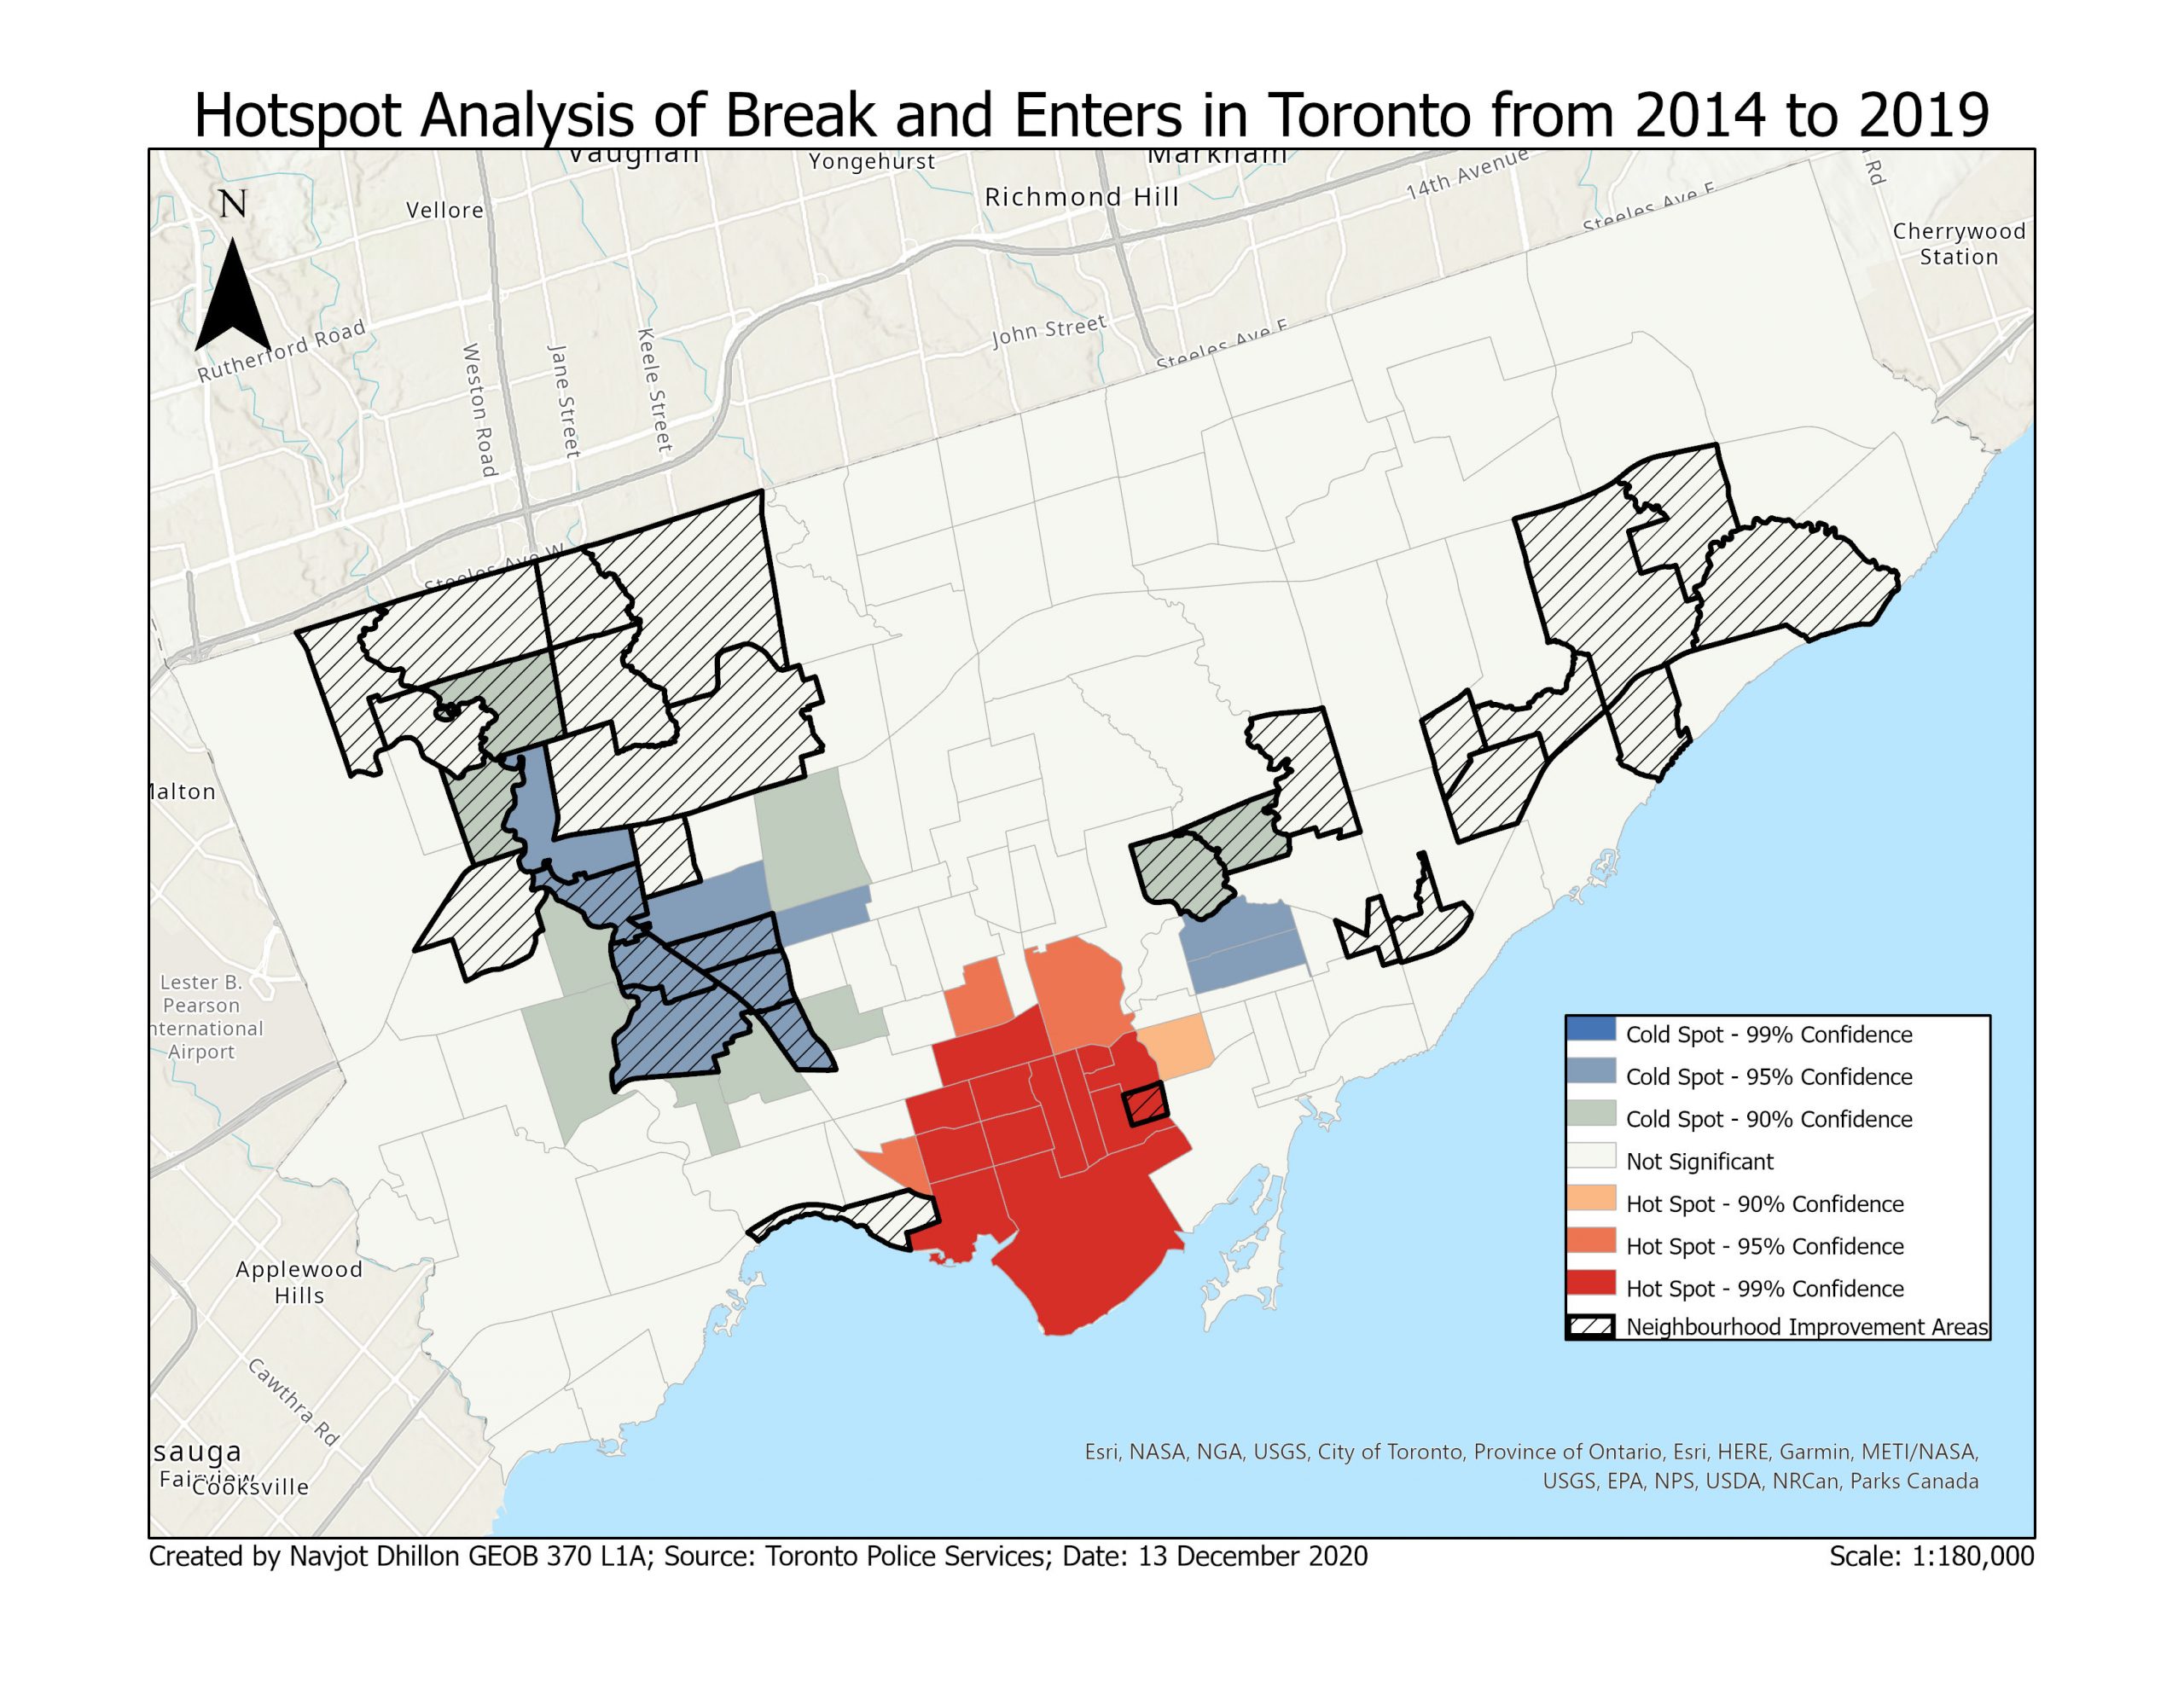
This hotspot analysis indicates areas that have a high clustering of break and enters that are statistically significant. The neighbourhoods coloured in red state a high level of clustering, as the z score in these areas is positive and high while having a low p-value, indicating statistical significance. There are also cold spots, which have strong negative z scores while being statistically significant. These cold spots are areas where break and enters are not clustered, but instead, they are dispersed. The neighbourhoods deemed to require improvements are also indicated on this map.
As with the hotspot map detailing assaults, there are many hotspots located in the downtown area of Toronto. However, as with the hotspot map indicating hotspots of assaults, only one of these neighbourhoods is classified as a Neighbourhood Improvement Area. However, many neighbourhoods are deemed to be Neighbourhood Improvement Areas, which are, in fact, coldspots for break and enters.
Homicides:
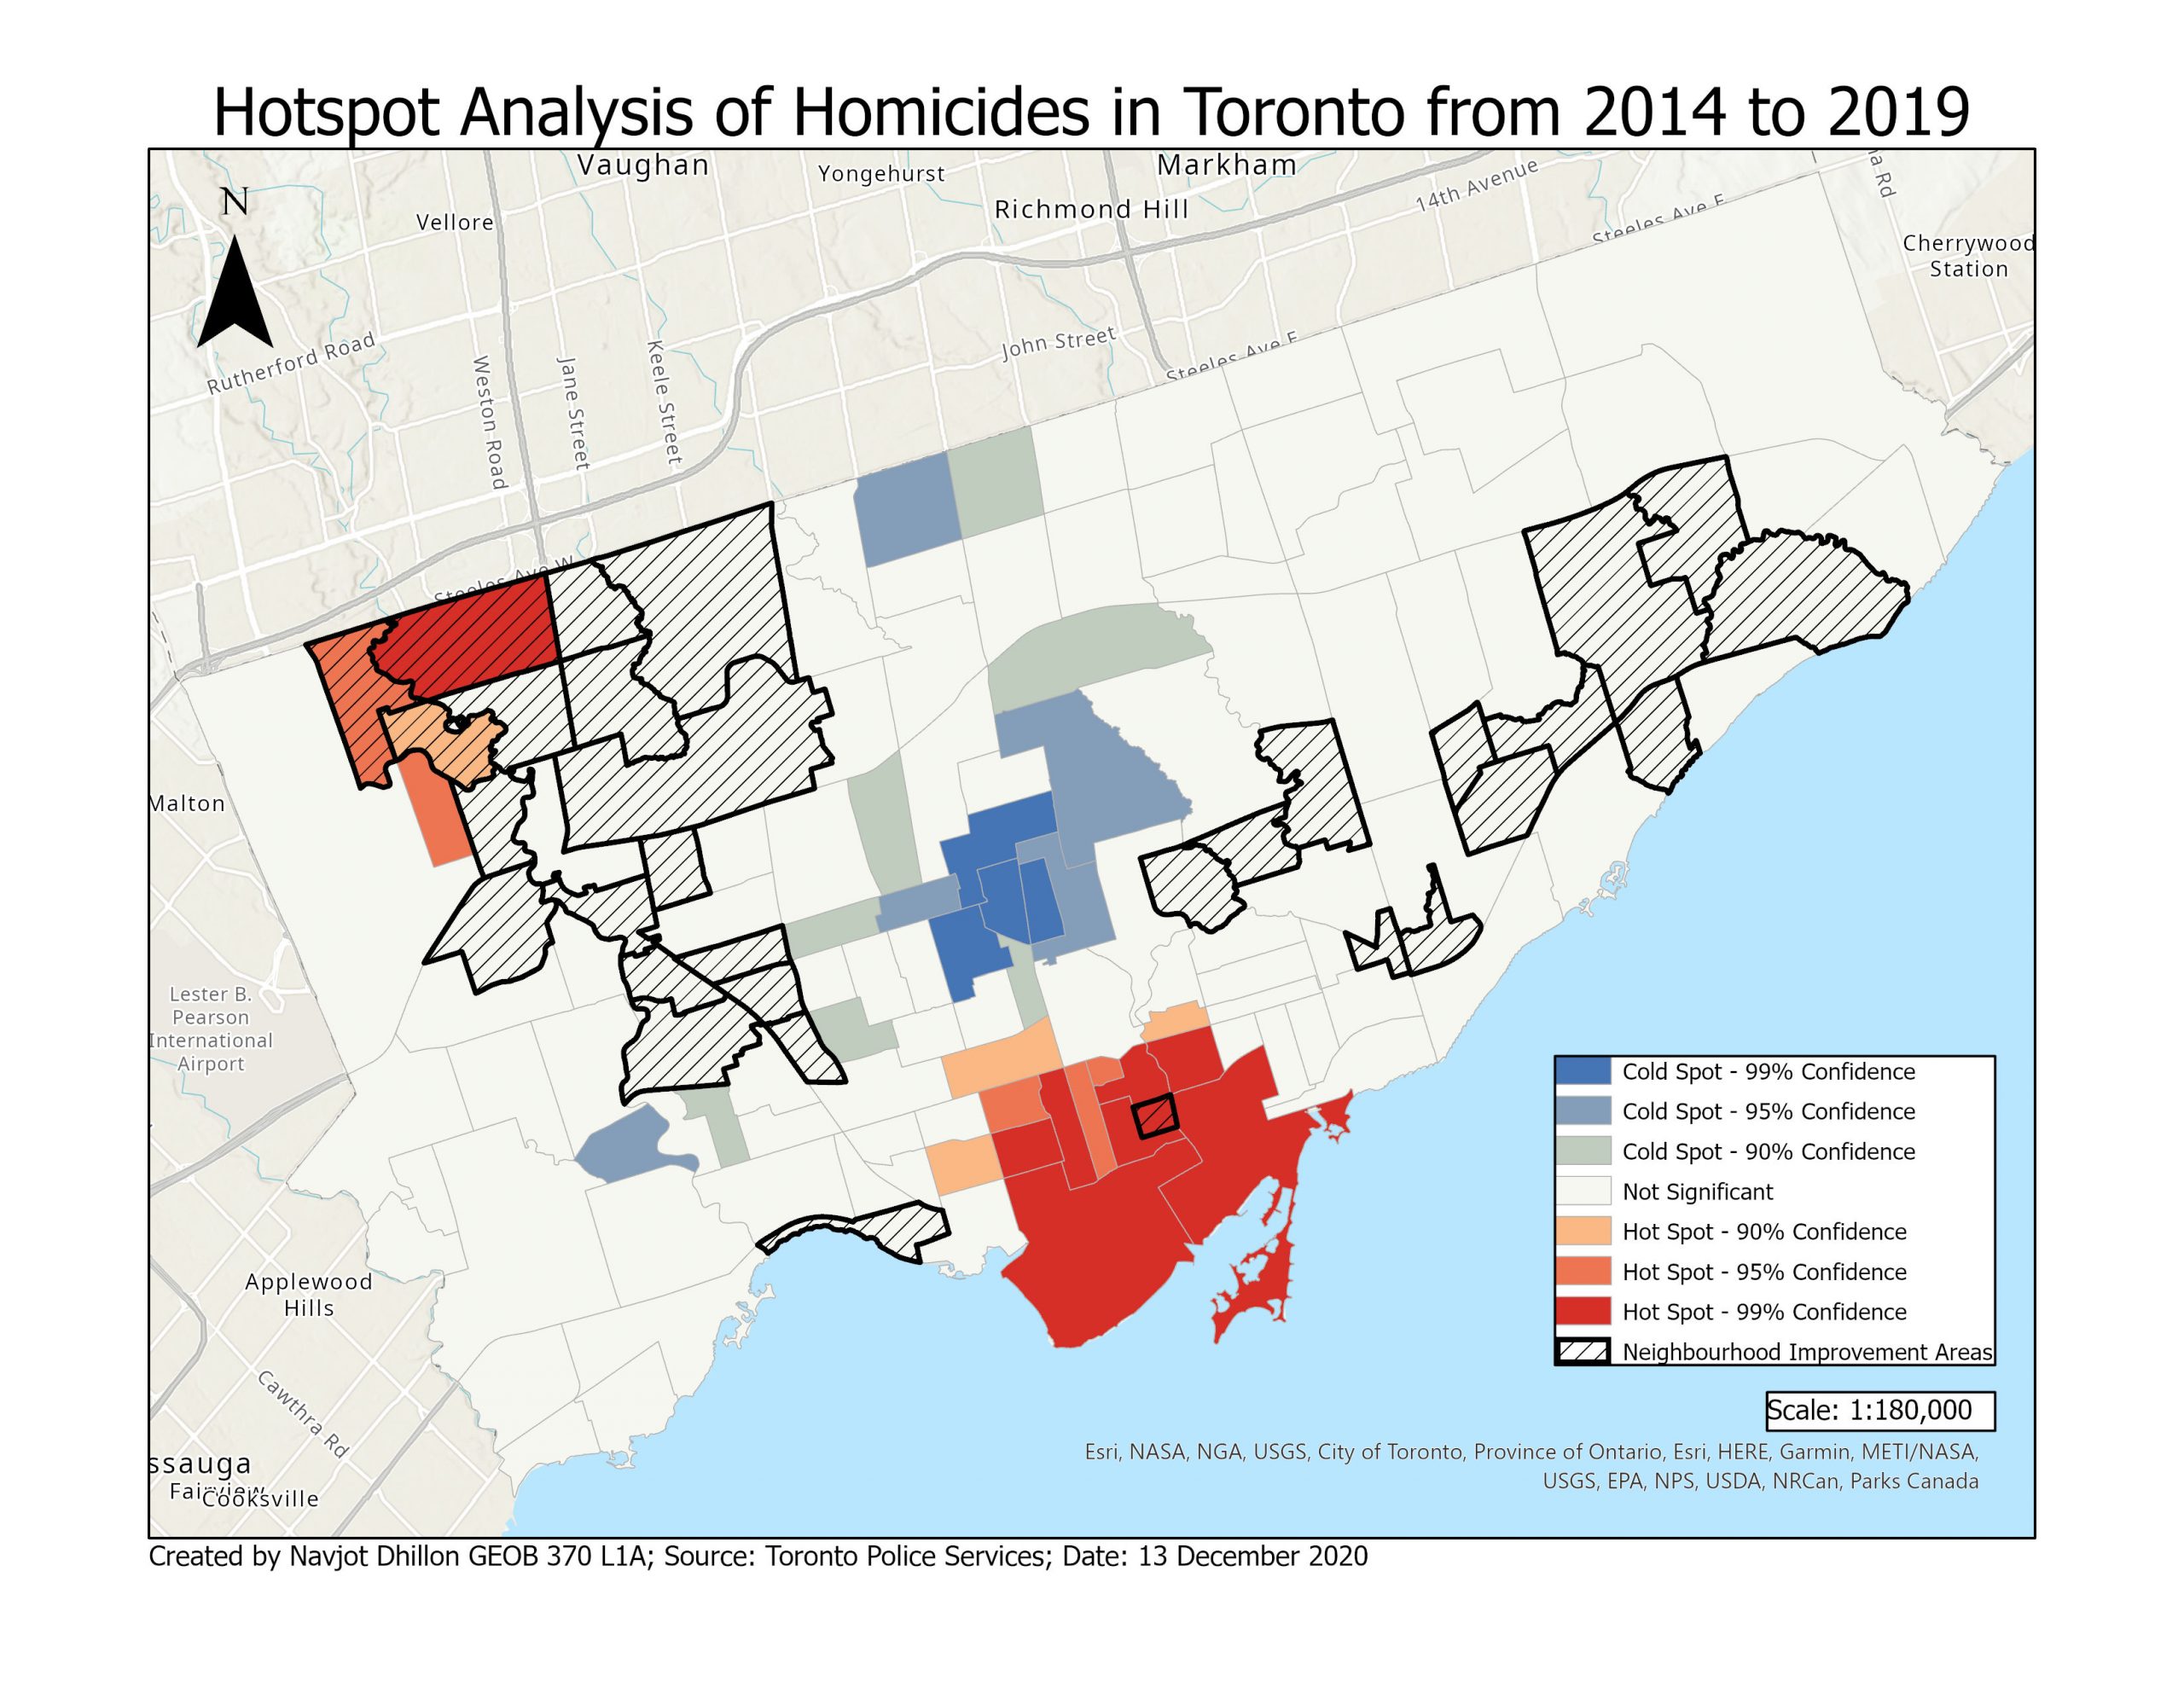
This hotspot analysis indicates areas that have a high clustering of homicides, that are statistically significant. The neighbourhoods coloured in dark red state a high level of clustering, as the z score in these areas is above 2.58. This z score is statistically significant, as the p-values are below 0.05. There are also cold spots, which have a strong negative z score while being statistically significant. These cold spots are areas where homicides are not clustered but dispersed. The neighbourhoods deemed to be in need of improvements are also indicated on this map.
Regarding hotspots of homicides, most hotspots are in the downtown area, as was the case with the hotspots of assaults and break and enters. The cold spots are located north of the downtown area, which was also the case with the coldspots of assaults.