Blog Update #4a: Revised Goal(s) of Experiment
To narrow down the scope of our experiment, we decided to only focus on goals 1 and 3 from Blog Update #3. We felt like these goals were ones that were not only simple to execute, but also had the most potential to produce interesting results. Aside from that, only minor wording changes were made for clarity and brevity.
- To test the effects of community-related elements (e.g. Facebook friends who have also donated) on promoting donation behavior.
- To test the effects of a segmented progress bar, or one that highlights individual user contributions, on promoting donation behavior.
Blog Update #4b: Experiment Method
Participants
10 participants will be recruited through convenience sampling. As a result, it is anticipated that our participants will be university students ranging from the ages of 19 to 25. This sample of participants is not completely representative of the entire target population (adults of varying socioeconomic statuses), given that most students are of the same socioeconomic status.
Conditions
In this study, we will investigate four different interfaces. Each of the interfaces have the same underlying structure, but with various features of interest toggled on or off to investigate their effect on donation behavior.
Regular Progress Bar + No Community Elements
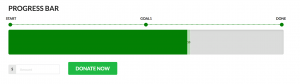
This interface represents a standard donation interface which uses a regular progress bar as a measure of progress towards reaching some target monetary goal.
Regular Progress Bar + Community Elements
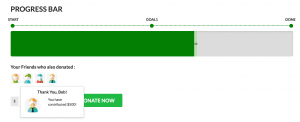
This interface retains the same standard progress bar as the first interface, but adds on community-related elements. Under the progress bar, there is a list of Facebook friends who have also donated to the same cause. More information such as brief description of friends and amount of money contributed appears when mouse is hovering over the profile pictures.
Segmented Progress Bar + No Community Elements
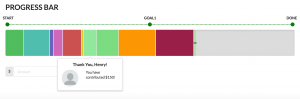
Instead of a regular progress bar, this interface features a “segmented” progress bar, where each segment in the progress bar represents an amount of money donated by a donor. The length of the segment is proportional to the progress made in terms of monetary amount towards the target goal. Users can hover over each segment to see the name of the donor and the amount donated. However, there are no community elements present in this interface.
Segmented Progress Bar + Community Elements
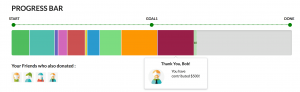
This interface contains a segmented progress bar, as well as the community-related elements as described above. When participants hover over the icon of their friends below the progress bars, it reveals a popup box indicating which segment of the progress bar their friend contributed to, and the amount of money they donated.
Tasks
Participants will be asked to evaluate and interact with four different donation interfaces (corresponding to the conditions above). They will be given a budget of $200 to specifically give to various causes or charities (see Section 4c for detailed task descriptions). After going through the four donation interfaces, they will be asked to allocate this money to each of the donation events, however they like. They can give as little or as much as they want (within $200) to each of the donation events. Each participant goes through the donation events in the same order, but the pairing of interface conditions to each donation event is counterbalanced with Latin squares to mitigate order effects and the potential confound of a particular donation event’s content.
Design
2 x 2 within-subjects factorial design, with 2 levels of community elements (inclusion of Facebook friends or no inclusion) x 2 types of progress bars (segmented or regular).
Procedure
Here we detail the basic template of our experiment procedure:
- Participants will be introduced to our study and asked to read and sign the consent form.
- Experimenter will set up experiment equipment with permission of participants, including: audio recording device, screen recording, and noting participant id.
- Experimenter will walk participants through a donation task description, which gives participants a situation to donate using a allocated amount of money. (More details in attached instruments)
- Participants will be presented with the experiment interface, which consists of 4 donation events each with different interface setups based on experiment conditions: each of the interfaces has the same underlying structure, but with various features of interest toggled on or off to investigate their effect on donation behavior.
- After finishing exploring each interface, participant will be asked to donate some portion of money in the budget and answer a short interview question about their impression of the interface.
- After looking through all interfaces, participants can decide if they want to change the amount of money that they allocated for donation to each of the 4 charities.
- A follow-up questionnaire will be provided to collect information about participants’ demographic information, preferences, engagement and trust levels on each donation events.
- A short interview will be given to collect more qualitative data based on feedback of participants’ questionnaire.
Apparatus
For convenience, the location of our experiment will take place in study rooms in the Computer Science building. The participant will be presented with a laptop computer that contains our interface prototype, as well as a piece of paper detailing the task description for easy reference. The laptop screen will be recorded to capture users’ interaction with the prototype. No location or hardware constraints were imposed for this experiment, as the key interaction will occur in the computer’s web browser.
Independent and Dependent Variables
Independent Variables:
All independent variables are within-subjects factors.
- Community-related elements (inclusion of Facebook friends or no inclusion)
- Progress bar type (segmented or regular)
Dependent Variables:
- Amount of money allocated to a donation event (quantitative)
- Decided by participant after evaluating and interacting with each donation event’s interface.
- Motivation to donate
- Measured by user rankings of donation events in terms of preference (qualitative).
- Measured through 5-point Likert scales about engagement and trust (quantitative).
Hypotheses
H1: Participants will donate more money to interfaces with segmented progress bars compared to regular ones.
H2: Participants will feel more motivated to donate to interfaces with segmented progress bars compared to regular ones.
H3: Participants will donate more money to interfaces that include community-related elements compared to those without them, except for when there is no segmented progress bar.
H4: Participants will feel more motivated to donate to interfaces that include community-related elements compared to those without them, except for when there is no segmented progress bar.
Planned Statistical Analyses
We plan to conduct an Analysis of Variance (ANOVA) to test the difference in means of donation amounts across our interface conditions. For our Likert scales, we plan to simply present descriptive statistics, as they are meant to be supplementary to results from the ANOVA and the rest of our qualitative data. Presentation order of interfaces, as well as donation event content will be considered as potential confounding factors.
Expected Limitations
Due to the limited time and resources available to complete the project, our proposed study has several expected limitations. First, the experimental task lacks external validity, as it is somewhat unrealistic, given that the budget assigned to users is simply a number, and not their own real money. In addition, because we intend to prompt users to donate some amount to each of these donation events, motivation to donate is, at a base level, forced in the experiment. This was a decision made to help us more directly investigate the effects of our interface factors.
Second, a potential limitation is in exploring donor motivation, as it is difficult to measure objectively. Given the scope of the experiment, we rely on the amount users decide to donate and their self-report on various Likert scale measures to do so. However, we suggest looking at literature on donor motivation to find more established methods of evaluating motivation to donate.
Third, another limitation could be the potential confound of the content associated with a particular donation event. The content or cause associated with a donation event could be a major factor in affecting how much money a user might want to donate. Although we have made efforts to try to mitigate this, it still remains as a limitation of our study. We felt that using the same content across interfaces sacrifices too much external validity for our experiment.
Blog Update #4c: Supplemental Experiment Materials