Results & Analysis
Employing the spatial statistics capabilities of ArcGIS, I conducted an Ordinary Least Squares (OLS) regression using the 1006 dissemination areas within the boundaries of the City of Vancouver. One DA was missing data, and thus not included in the regression analysis. The dependent variable was median value of dwelling ($) at the dissemination-area scale. The independent variables were those best chosen by the exploratory regression, and described in detail in the Methodology. These were EDUC, CONDO, NEAR-DIST, EAST, and ROOMS.
The results yielded an adjusted global R2 score of 0.73, which meant that the model explained 73% of the variation in property values. All the independent variables had statistically significant coefficients, as well as low variance inflation factor (VIF) scores which indicated they were not redundant. These were the summary results:
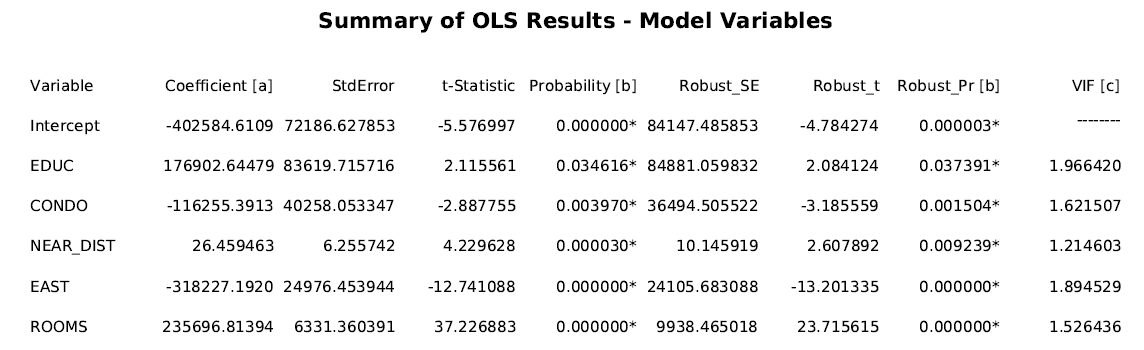
The regression results show that the most significant variable is the average number of rooms per dwelling, which is expected: property value increases with more rooms. To be precise, with each extra room per dwelling, the property value increases by $235,697. The dummy variable which coded DA’s as being east- or west-side produced interesting results. Just the simple geography of being on the east-side of the city will reduce the median property value by $318,227, which is a huge number.
Other variables included were % CONDO which was negatively associated with property values. In other words, the more condominiums in a dissemination area, the lower the expected property value. This is expected due to the high value placed on single family dwellings in the Vancouver market, and the lower prices associated with condominiums. Furthermore, the more highly educated the population within a particular DA, the more likely the median dwelling value is to go up.
What was most interesting was the results of the regression with regards to the distance to Skytrain, which was actually positively associated with property value. With every meter increase in in distance away from the nearest Skytrain station, the value of the property increased $26.46. While I went into the study initially expecting the opposite result (ease of accessibility), it is clear now this is not the case. The reality is that the east- and west- side effects of Vancouver play an integral role in shaping the price of housing. While I think the presence of noise and/or aesthetics may have influenced property values to a certain extent, I believe the larger contextual history of the divide has influenced the results. In other words, Skytrain is not directly affecting lower values in property, but rather homes lower in value have so happened to be located closer to Skytrain stations. Conversely, wealthier homes tend to be located further away from Skytrain stations, though this has changed slightly with the introduction of the Canada Line. I would suspect that if this model were to be conducted before the opening of the Canada Line, then the results would be even starker.
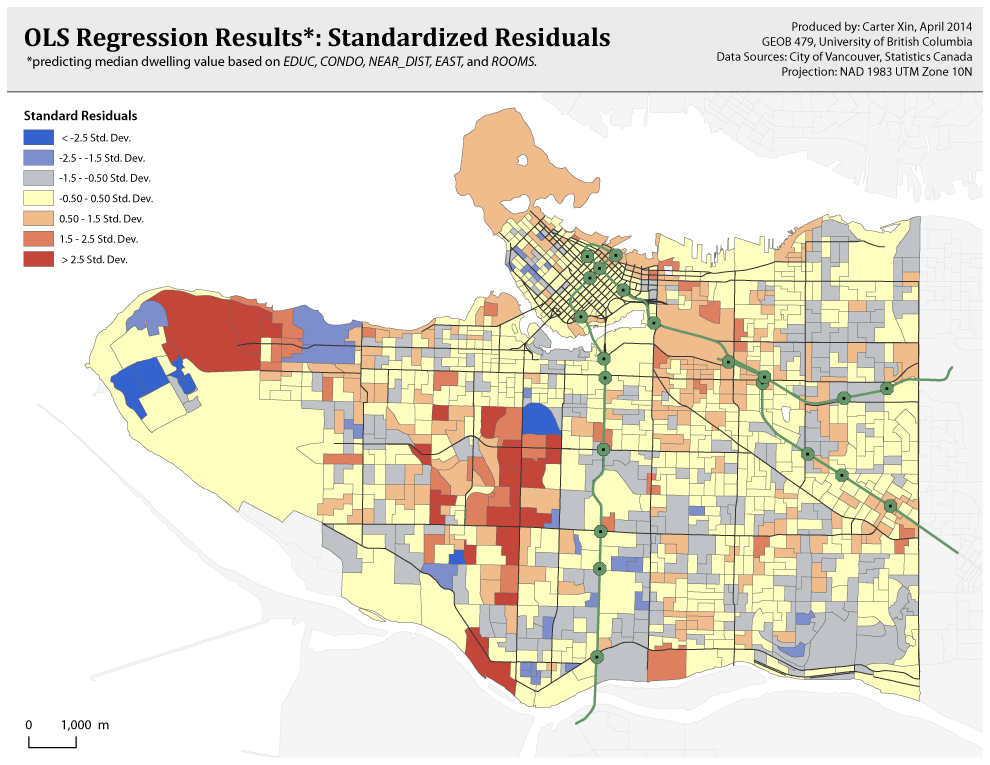
Upon examination the residuals from the OLS regression, it is clear there is some spatial patterning, particularly in the neighbourhoods of Shaughnessy and Point Grey where property values are underpredicted (i.e. they are actually much higher in these areas) even with the inclusion the east-west dummy variable, this is the case. While this is certainly not a perfect model (see Limitations), the limitations of data prevented me from improving or adding to the existing set of predictor variables. In the next step, I use a geographically weighted regression (GWR) to examine the local variations of the relationship between the independent and dependent variables. The statistically significant Koenker (BP) statistic indicates that the results are not consistent spatially and that a GWR could illustrate these geographic differences. As the table below shows, the GWR model helps explain more of the variation in the data (R2 score of 0.81 compared to 0.73) and the AICc score shows a drop of about 324 points, which means an improvement in the performance of the model.
| OLS | GWR | |
| Adjusted R2 | 0.732 | 0.809 |
| AICc | 28124.543 | 27800.272 |
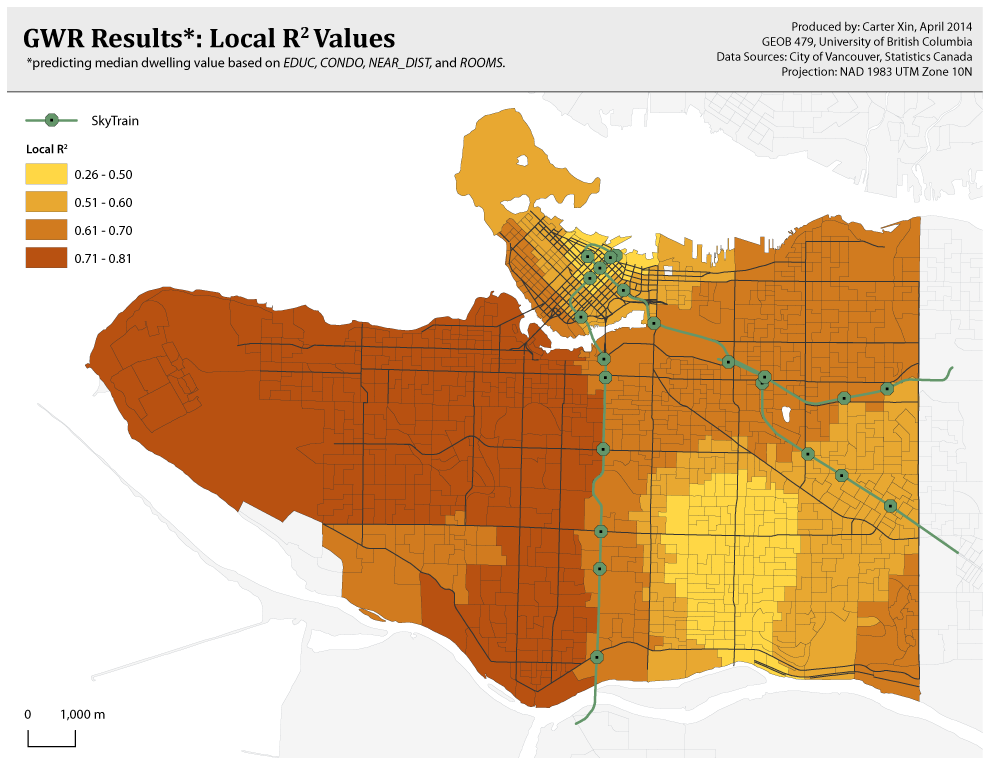
In terms of local variation, the results of the GWR showed that the equation worked best almost exclusively in neighbourhoods on the west side of Vancouver, with R2 scores between 0.71 – 0.81. The model also worked quite well around Mt. Pleasant, Grandview-Woodlands, and Hastings-Sunrise. However, immediately east of Main Street particularly around Knight and Victoria streets in the neighbourhoods of Sunset and Victoria-Fraserview the R2 value was below 0.5. Even when considering all the variables of rooms, distance, percentage condos and education (the east side dummy variable was removed in the GWR), there are still unexplained factors which may influence the property prices in these areas with low R2 values. I believe this has mostly to do with the split in neighourhood characteristics, and “prestige” of living on the west side. Consequently, moving west to east means a significant drop in property value.
The Downtown peninsula is an interesting story: the R2 values gradually become larger moving from Coal Harbour and the business district towards the southwest edge (areas closer to the English Bay and Sunset Beach side have the highest R2’s) . This could possibly be attributed to newer construction on the Coal Harbour side making the prices unstable – perhaps, with sometimes high prices for small units.
My final map examines the variability of the coefficient for the NEAR_DIST value over space. While the OLS regression found a positive relationship between property value and distance globally (the further away from a Skytrain stop, the more the price), the GWR results consider the more nuanced geographic variability which, as the map below shows, can result in a negative relationship as well. This coefficient map is quite fascinating, as it maps out – for each dissemination area – how important transit was in determining the median property value.
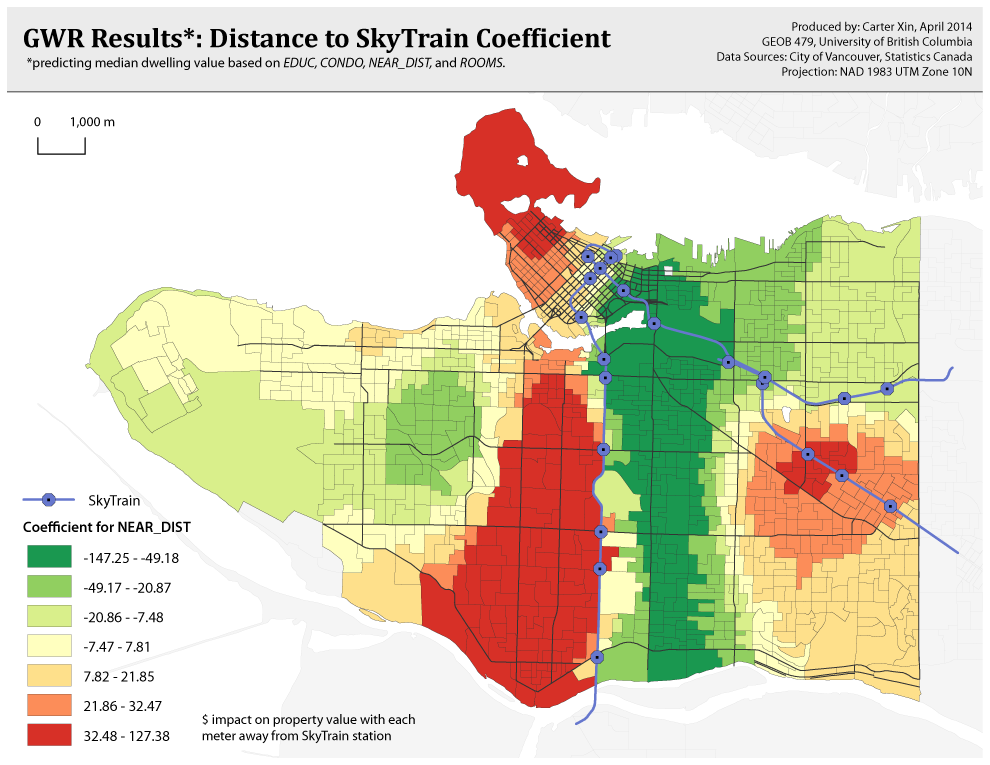
Starting with the west side, the neighbourhoods of Shaughnessy, Oakridge, and Marpole have the highest coefficients, which indicate that for these areas, being away from Skytrain improved property price levels, in line with the results of the OLS regression. Interestingly enough, some dissemination areas in the West End were also in the same group – as well as the cluster centered around Nanaimo Station. An explanation for the West End would be that properties closer to Stanley Park (and therefore, away from the station) produce higher values. For Nanaimo Stations, perhaps the negative aesthetic and noise pollution from being close the Skytrain for many years has caused this result. It would be interesting to see if the map and results change if an explanatory variable was added indicating whether stations were above or below ground.
On the flip side, the green shows areas which gain in property value due to closer proximity to Skytrain. In the legend, the numbers describe how with each one meter increase in distance from Skytrain, the price drops x amount, hence the negative numbers. These areas are centered directly to the east of Cambie Street, particularly in the neighbourhoods of Chinatown, Downtown Eastside, Strathcona, Mt. Pleasant, Riley Park-Little Mountain, and Sunset. Arbutus Ridge, Grandview-Woodlands, and Hastings-Sunrise also have negative coefficients. All these areas confirm my original hypothesis that areas close to Skytrain stations possess a higher value in property.
What is likely happening is that, for these neighbourhoods with negative coefficients, SkyTrain access is important and a large percentage of individuals commute by public transit for trips. Nestled perfectly in between two (or three) of the Skytrain lines, access is also relatively easy – just a short walk, bike or bus ride away. For these reasons, homes being close to the Skytrain is a good thing which increases property value. However, many other “red” neighbourhoods with positive coefficients were also close to Skytrain stops (those directly west of Cambie) yet show the opposite effect of increasing property value moving further away. Perhaps what is happening here relates to demographics and lifestyle choices: those on the west-side are relatively wealthier, live in larger homes, and have a higher number of individuals owning and commuting by car – therefore, Skytrain is not of importance, and actually devalued. The population east of Cambie St. seem to embrace public transportation as an option and see Skytrain as ultimately a benefit to the value of their home.