Describing our Final Map
As discussed in the Results, while we achieved minimal slope change, and minimal distance maps, we were not able to create a route that minimized both these things. The theory behind what we were trying to do was simple enough, but creating the rules that allowed for that caused us great difficulties. We ended up with some remarkable results, and some very interesting, very questionable ones. In places, the minimal slope path would route itself around entire mountain ranges to avoid increasing elevation, leading to large increases in total distance as previously mentioned, seen in the case of the path from Twizel to Timaru. This was what it was supposed to do and therefore was considered a success of the analysis. 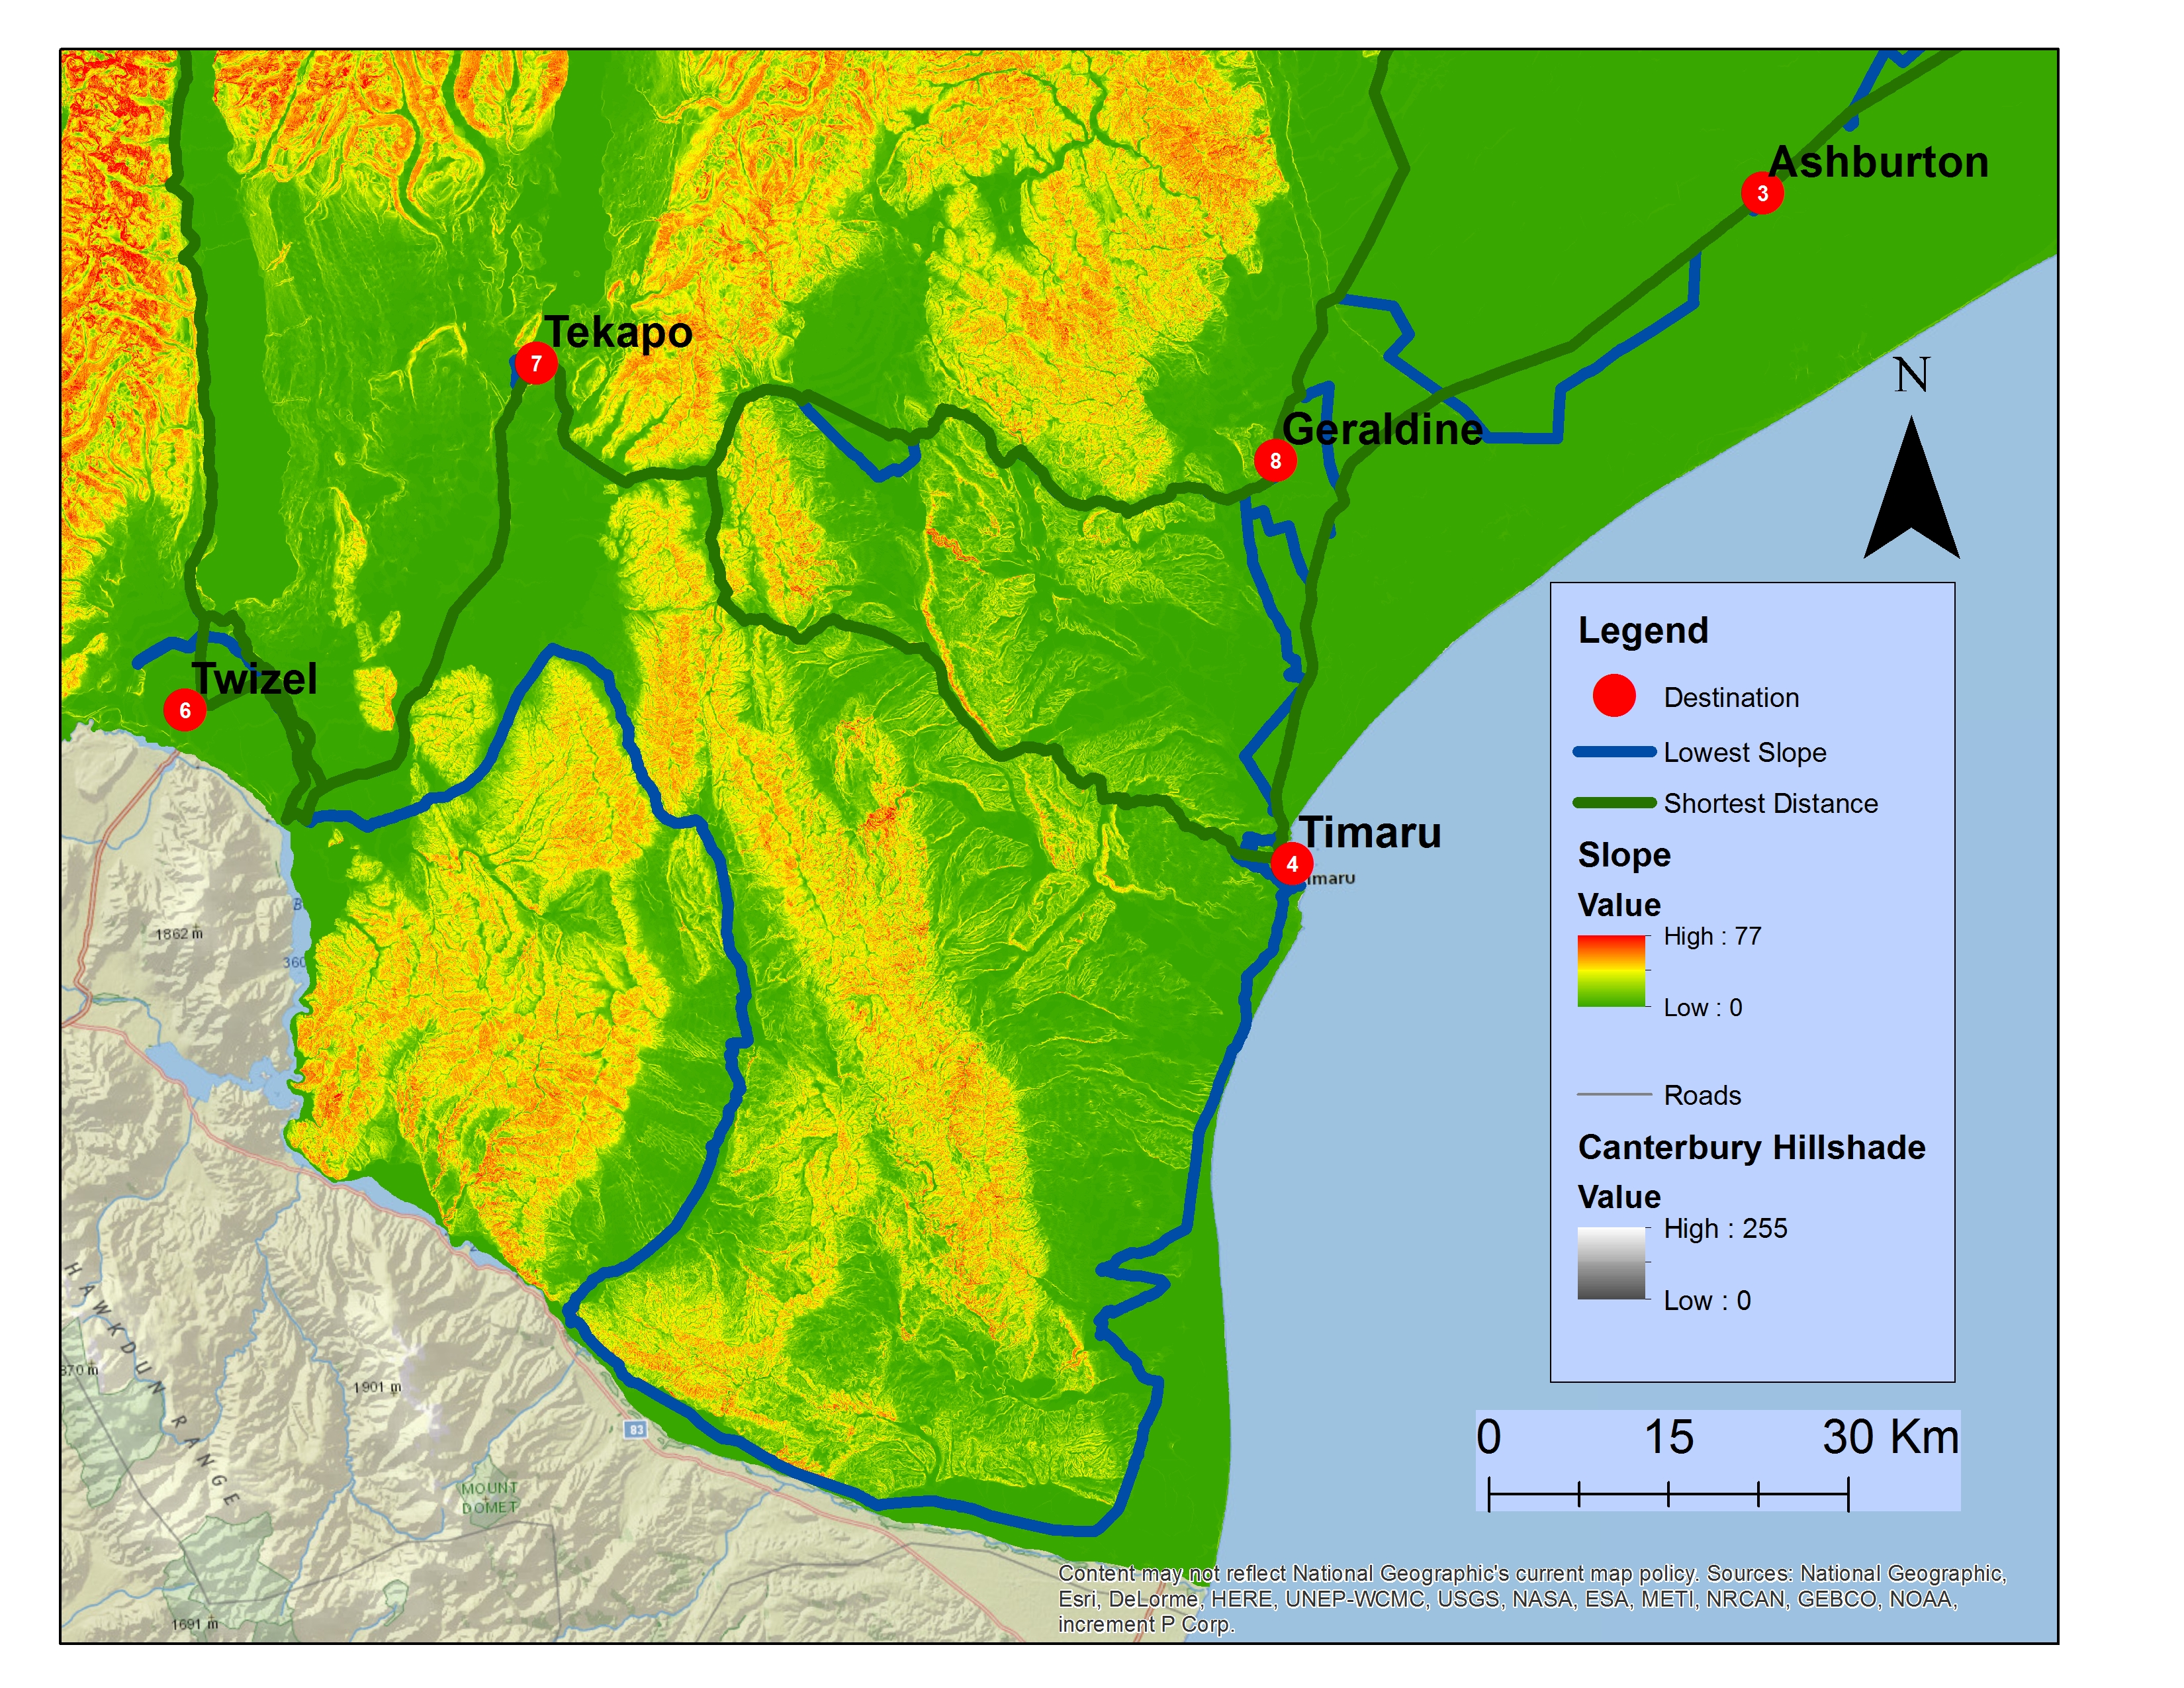
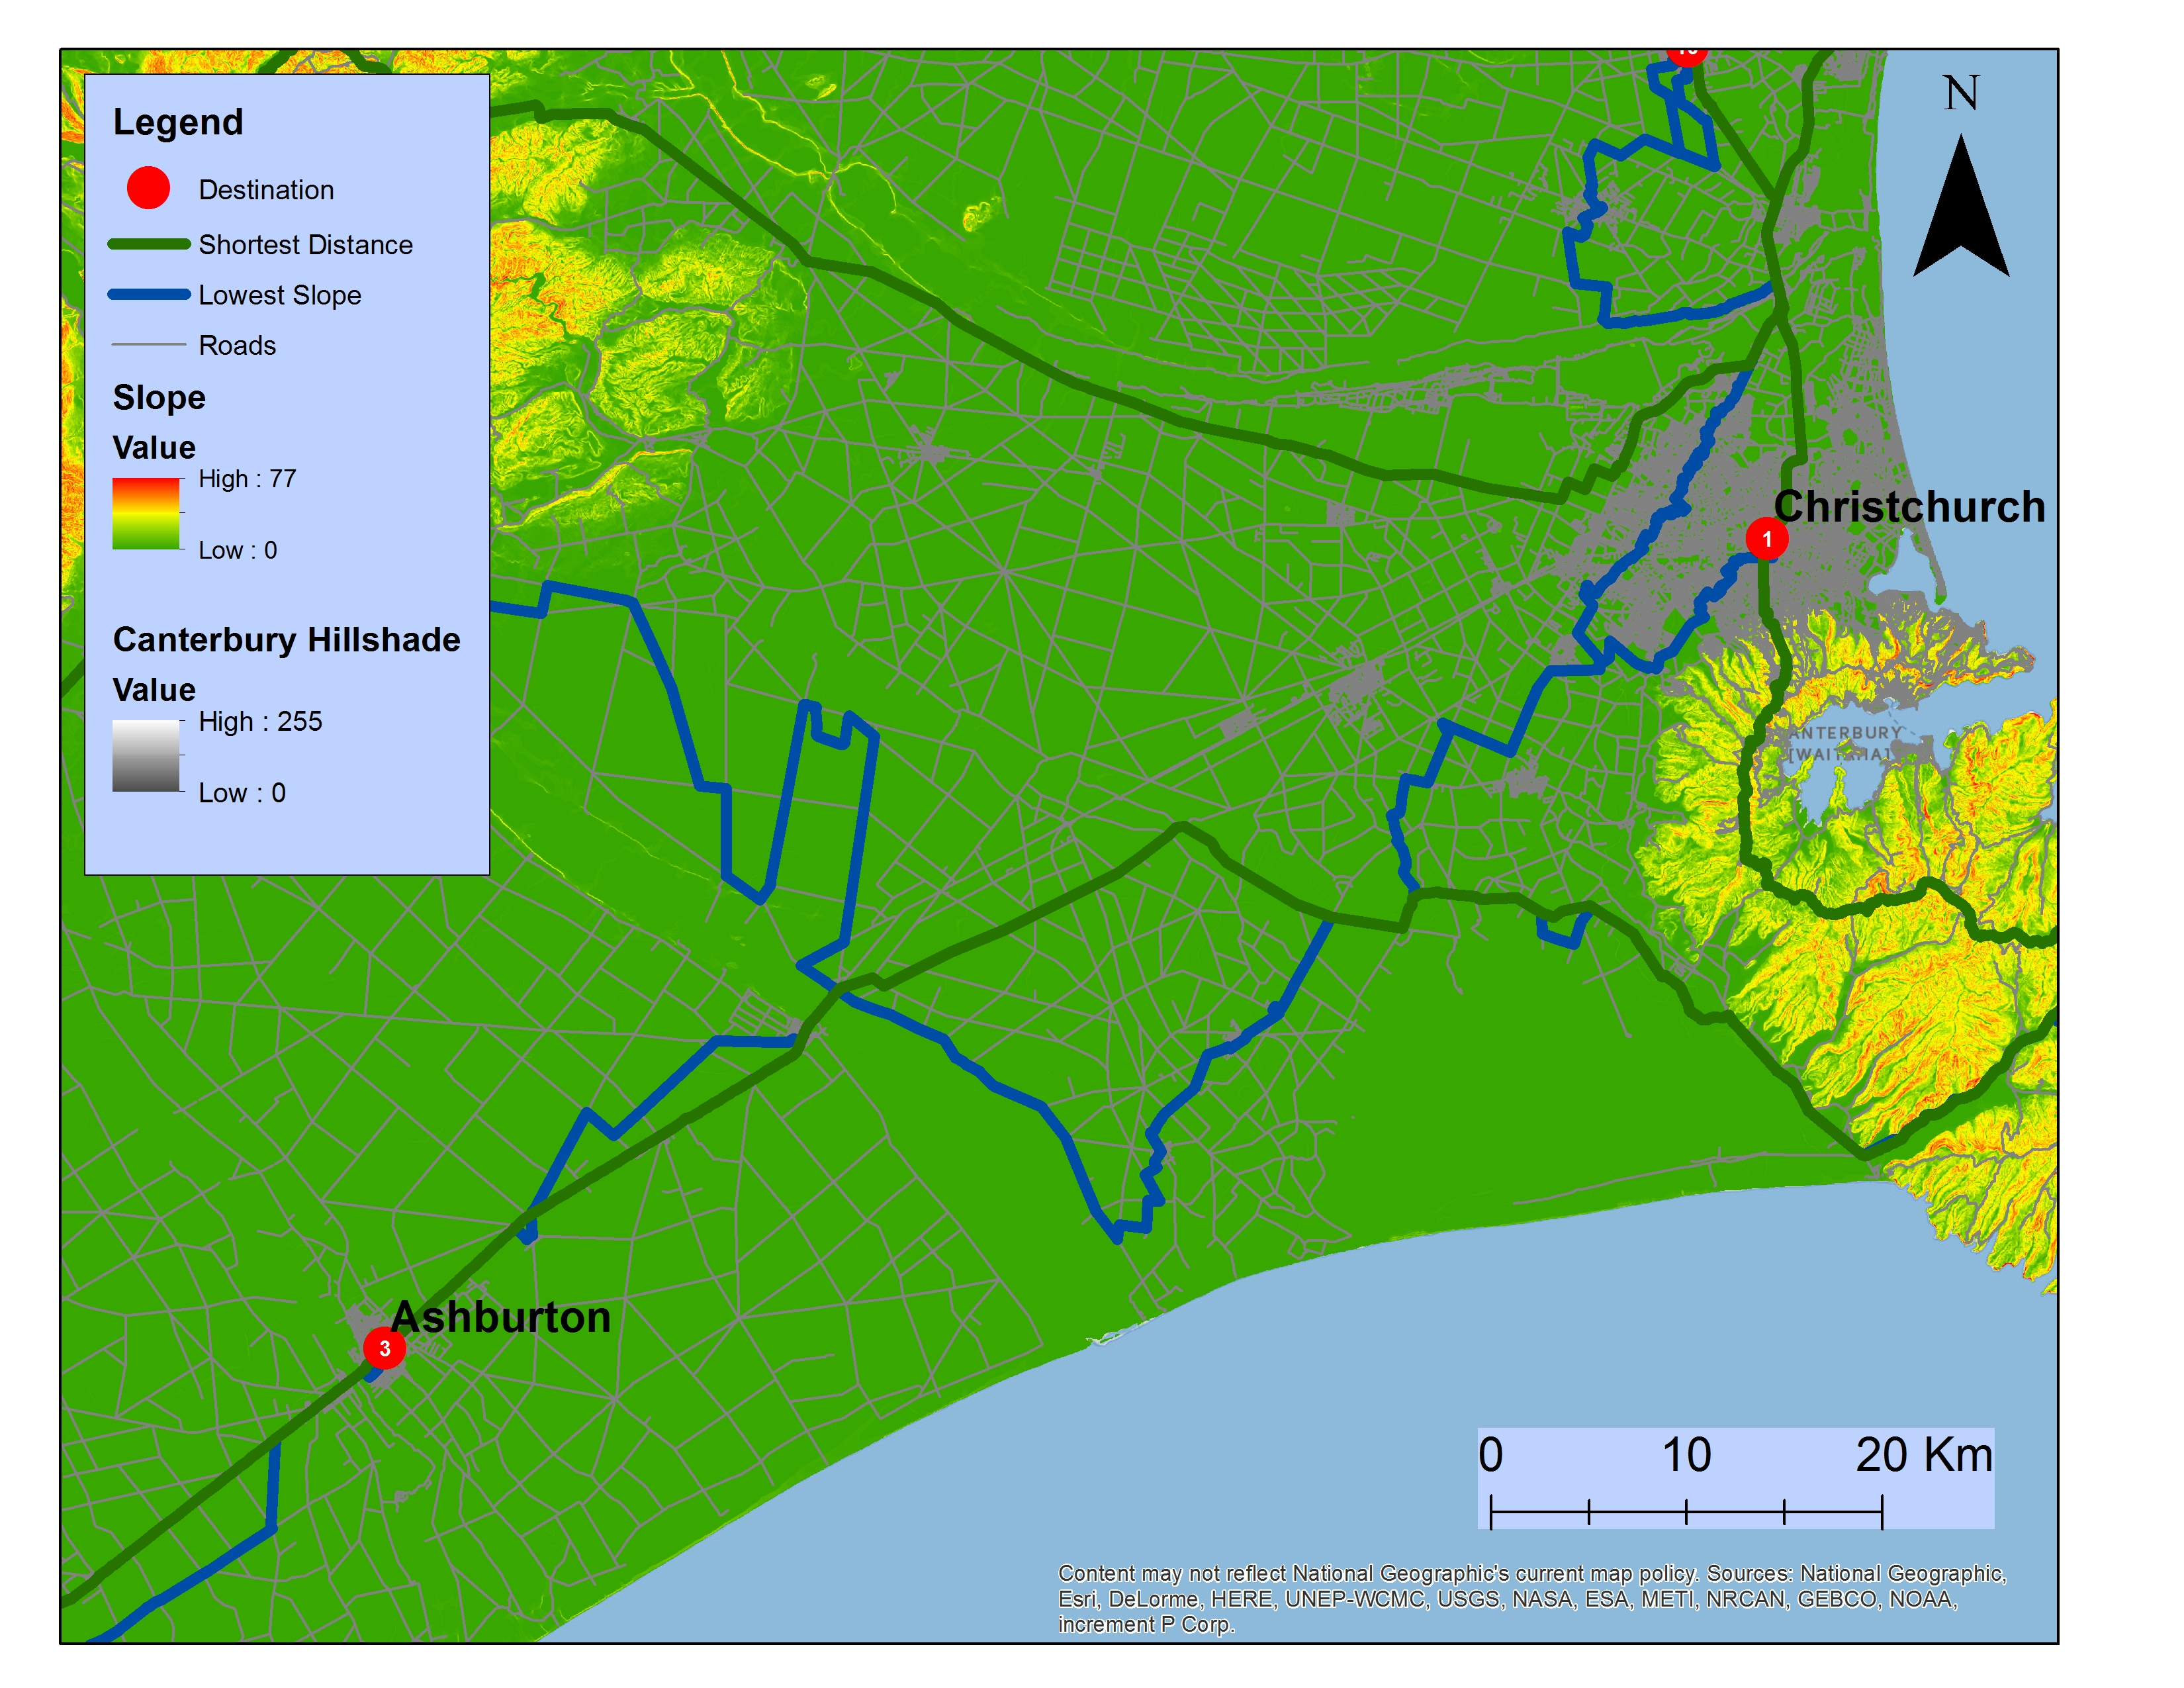
Another region where we can see our analysis working as we would expect is surrounding the mountains of Akaroa. Here, one of the sides has very steeply sloped roads in comparison to the other. The minimal slope route traverses around the steep slopes and cuts into the city through a valley towards the south and back along the same route. The shortest distance route however, comes in across the steeper, more direct roads to the north, and leaves along a different path to the south.

The analysis struggled greatest, however, in the low lying regions of Canterbury, where there is an extensive road network in place. Because of the lack of direction in the parameters, it could not choose between two routes that had equal slope. The flat, Eastern side of Canterbury has an extensive road network, with very little elevation change from one road to another. As far as Network Analyst was concerned, all of these streets were ‘cost free’ as they didn’t increase the elevation, and there were sorts of strange twists and turns that were not taken in the route that minimized distance. 
Sources of Error
Firstly, we did not take different road classes into account when calculating the route. Therefore, the cyclist may find themselves biking along a highway, or some other main road, while there is a much more appropriate quieter road running parallel to the main road.
There is also an issue with the slope values calculated using the ‘Add Surface Information’ tool. The slope values that were calculated ranged from 0 to 77 degrees. More than half of this range is physically impossible. There is not a single paved road that measures 77 degrees. Cars are not able to drive up these slopes, let alone cyclists. For this reason, when determining the symbology, every slope angle above 29 degrees was considered the same. Having information regarding the slope of roads beyond that value was unimportant as they were incorrect results anyway.
Lastly, as we have previously discussed, our final output route for minimal slope did not take into account length of the line. That means that while it minimizes the elevation change, it has no regard for how long a route it is creating, which means it is not creating the most efficient route at all. In fact, it creates a route that is over 1000km longer than the shortest route path.
Conclusion: Did we Answer our Questions?
In our introduction we asked three questions:
- Is it possible to see a wide range of destinations all over a certain region of the South Island (we’ve been told, if we’re going to stick to half, this was the half we should choose) from the back of the bike?
- Is there sufficient road coverage to get from location to location without too tough a ride?
- What would be the best order in which to visit desired locations?
Essentially we did answer our questions. Yes, it’s possible to see New Zealand from the back of a bike. The road network is extensive enough, there are ways to avoid mountains, and other areas of high slopes and the stops are close enough to make it between them all. We produced two routes with different orders of visiting each location so we answered our last question with two answers. We did not fully accomplish our goal though of finding the BEST route or order of stops. This is a good goal of future projects.
Areas of further study, what we would do differently next time
It would be fairly easy to design a follow up study to this. While we created route maps across the province, we did not utilize all the data available to us. We had data for campgrounds, public toilets, museums, and more, but only used elevation and road data. A future study could focus in on a smaller region and analyze the spatial distribution of attractions and amenities. Alternatively, it would be easy to take this data as a tourism company and, using the campground data, determine where the areas of greatest need are for new ones given population densities, proximity to popular destinations, and other campgrounds.
We have talked at length of the challenges we faced in this project, as a result, we have a few ideas of how we would approach this project differently. Firstly, we would choose a smaller study area. Using an entire province drastically increases the amount of data you are working with, and things take a lot longer to accomplish, from tasks as simple as copying data, to running tools.
What hampered progress in this project was not having a clear map of the steps that we needed to take to accomplish our analysis before beginning. It meant that we went down a few serious rabbit holes, and spent numerous hours making little or no progress. We also downloaded lots of data that ended up not being useful. Having a better plan in mind before beginning could have saved us lots of trouble along the way.