Monthly Archives: December 2017

Lab 5: Environmental Assessment for Garibaldi Ski Resort

Judgement as a Natural Resource Planner

A new ski resort project has been tentatively approved in January 2016. The proposed Garibaldi at Squamish project will be located in Brohm Ridge which is along Highway 99. In response to its submission for a Project Approval Certificate under the Environmental Assessment Act in 1997, the BC Environmental Assessment Office released a report in 2010. The report requested more substantial information on the potential impacts on endangered ecosystems and wild habitat. Furthermore, the Resort Municipality of Whistler strongly opposed the project with the reason that skiing is not safe on the lower 600m of vertical due to the concerning warming effects of climate change. On behalf of the British Columbia Snowmobile Federation (BCSF), my responsibility as natural resource planner was to examine the Environmental Assessment’s recommendations and Whistler’s criticism to evaluate whether there is sufficient evidence to continue my opposition against the ski resort project.

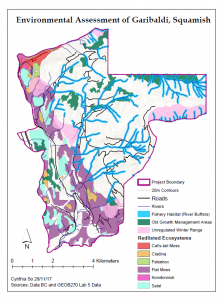
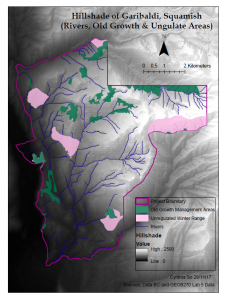
To do so, I undertook a process of acquiring spatial data sets, such as the Ungulate Winter Range for wildlife habitats and the Old Growth Management Areas from DataBC. This was followed by a series of parsing and filtering out irrelevant data to suit the objective of this inquiry. Next, by using a variety of spatial analysis tools, I was able to calculate the area percentages of polygons in relation to the total size of the project area, use a multi-field query to select attributes of interest, and create a river buffer for riparian habitats. Last but not least, I produced a map that highlights the potential impact of the project on the surrounding environment. From the GIS analysis, results show that 31.8% of the project area is below the 600m cautionary line and that at least 60% of the project area falls within the protected areas.

Altogether, the proposed ski resort project poses a significant ecological and environmental threat to the Squamish area. Therefore, the full approval and construction of it is highly not recommended and my initial judgement to oppose it still remains unchanged. The reason being that the two greatest environmental concerns to project development is slope failure and snow avalanches. In both cases, injuries and casualties will be difficult to avoid given the fact that warmer climatological conditions will increase the risk of such large-scale events. The best way would be avoid building on unstable slopes and grounds altogether. However, in the case that the project proponents do successfully push through, then workers and machine operators must proceed with caution, evaluate the snow pack and weather regularly, and take all safety measures to minimize the risk of injuries or loss of life. The proponents should also work with engineers to stabilize slopes, as well as with geomorphologists to study the watershed and carefully redirect sources of sediment supply and water.

Personal Opinion

On a personal level, I strongly think that this project should not be allowed to continue as well. Investments should be redirected to focused on developing, renovating, and improving existing resorts. Even if the area has potential for value creation and enhancement, it does not necessarily mean that the value or benefits generated from the new resort will be captured by the local people who live in that region. Often times multinational corporations are profit driven and give limited consideration to the environment, wildlife, and quality of life of the those who rely on the land for a living. The land will have to be cleared to create an artificial pristine landscapes and torn apart to install key infrastructures. Small business owners will most likely lost some degree of autonomy because they will be preyed upon by large corporations and be pressured to conform to the standardized management system as well. In addition to these issues, climate change will exacerbate snow melting conditions, rendering it more challenging to sustain a safe and pleasurable skiing environment in the long run, while increasing the risk of the resort being abandoned and left as a ghost town. All in all, the short term advantages of a new resort do not outweigh the long term costs, so I am strongly against the continuation of this project.

Lab 4: Housing Affordability Comparison Between Vancouver and Ottawa

Comparison of Data Classification Methods

Depending on which quantitative data classification you use, it could produce drastically different results. This is demonstrated in the Cost of Housing in Vancouver Using Four Data Classification Methods. For instance, if I were a journalist I would most likely choose the Standard deviation data classification method to show my audience. This is because the data is skewed to the right and does not show a normal histogram/distribution. As such, it would indicate to my reader that the average cost of housing is much greater than the median cost of housing in Vancouver. Plus, given that the high housing costs in Vancouver are still rising it would make sense to use standard deviation to show that trend. However, one of the disadvantages of using this method is depending on the general reader’s education level and familiarity with statistics, the Standard Deviation method may be confusing to some readers.

Again, if the purpose is completely different I would certainly have to reconsider which type of data classification I would use achieve the best results. Compare being a journalist to, let’s say, a real estate agent. If I were a real estate agent I would pick the Natural Breaks classification method instead. This decision is driven by the reason that it is relatively easier for prospective home buyers to process and understand statistically than Standard Deviation. Visually, it effectively gives the buyer a better sense of the uneven distribution of housing costs across Vancouver, no matter how subtle that difference may be to begin with. In other words, it would give the impression that the buyer has more options to explore. This could potentially translate to a higher chance of a successful deal for the agent, particularly if the buyer is feeling optimistic, is willing to invest a considerable amount of time and money, and is lucky enough to find their perfect match. A win-win situation for both the real estate agent and the home buyer.

Comparison of Housing Affordability in Vancouver and Ottawa

Essentially, Affordability measures the relationship between median household income and income needed to purchase a median-priced house. In comparison to housing cost, housing affordability is a better indicator because displaying housing cost alone will not convey important information about whether or not individuals or families have the financial capability (i.e. income) to purchase a residential property for personal use.

The housing affordability rating categories used to create this map was determined by the 12th Annual Demographia International Housing Affordability Survey 2016 (Wendell Cox Consultancy & Performance Urban Planning: Christchurch, New Zealand), a reliable report that borrows findings from countless other surveys and studies to help tackle the housing affordability problem all around the world. The housing affordability rating classification ranges from a Median Multiple of 3.0 or less being ‘affordable’ to over 5.0 being ‘severely unaffordable.’

While housing affordability is definitely a good indicator of a city’s level of livability, it is not the only factor that matters. Other components of living needs to be taken into consideration as well, including job markets, safety, entertainment, transportation, pollution etc. If you solely focus on housing affordability, it becomes very easy to assess a city by its survivability rather than its livability. Furthermore, it is important to keep in mind that the housing affordability rating categories has its limitations. To quote Oliver Hartwich, the Executive Director of the New Zealand Initiative, he comments: “The ‘median multiple’ is not a perfect measure because it does not account for house sizes or build quality.” As such, a city’s level of livability also depends on the type of residential housing that people can afford to live in, such as houses, apartments, condominiums, lane housing etc.

Accomplishment(s)

  1. Demonstrated a solid understanding of how to preview, organize, and explore the properties of spatial data using ArcCatalog.
  2. Repaired misaligned and improperly referenced spatial data (i.e. coordinate systems and projections) using metadata and geoprocessing tools.
  3. Conducted a geographic hazard assessment of a tsunami risk through spatial analysis, statistical calculations, and cartographic design.


Lab 3: Planning for a Tsunami in The Metro Vancouver Area

A map of Vancouver showing all the danger zones that are potentially at risk of being impacted by a tsunami.

Using data from a digital elevation model of Metro Vancouver to delineate areas that have an elevation under 15 meters and  dividing the total area under danger (approximately 660 square kilometers) by the total area of the area of study, I found that over 50% of Vancouver is in danger of a devastating tsunami event. The areas represented in red are the danger zones that lie within 1 kilometer of the coast, and are therefore, at highest risk of being impacted by a tsunami.

Many of the most important healthcare and educational facilities are located within the boundary of the danger zones. Using a tool called Overlay-Intersect to create a new map layer that showed the all the healthcare and educational facilities that lies within 1 kilometer of the coast and at elevations under 15 meters. From this process, I found that Broadway Pentecostal Lodge, Coastwest Community Home, False Creek Residence, Villa Cathay Care Home, and Yaletown House Society are the healthcare facilities at risk. Meanwhile, École Rose Des Vents, Emily Carr Institute of Art and Design, False Creek Elementary, Henry Hudson Elementary, Heritage 3Rs School, the Institute of Indigenous Government, St. Anthony of Padua, St. Francis Xavier, St. John International, and Vancouver Montessori School are all the educational facilities that are at risk.

Lab 2: Coordinate Systems and Spatial Data Models

Fixing Misaligned and Improperly Referenced Spatial Data

There are several ways that you can fix misaligned and improperly referenced spatial data. The first option is to simply let ArcGIS do its magic. Through a process called projecting-on-the-fly, ArcGIS will essentially take maps with different coordinate systems and align them together automatically as if they are on the same coordinate system without actually changing the coordinate system itself. The only downside to this method is that it is only for temporary display purposes. Projecting-on-the-fly is a band aid solution and will not solve the root problem (i,e, using differently georeferenced data), which will cause immense trouble when you start to geoprocess data and use spatial analysis tools. Alternatively, you could use the commands, Project from the ArcToolbox. The Project tool allows you to manually pick the specific data set that you wish to modify and convert its original coordinate system into a different one. Therefore, creating a new layer with the proper spatial reference system that you want to use.

Advantages of Landsat Data

In a nutshell, raster data represent features as a matrix of cells within rows and columns. This can be seen from remotely sensed Landsat imagery or other aerial photographs. Raster data models are very commonly used to represent the world because of several advantages. One of them is the fact that data can be represented at (nearly) its original resolution without generalization. This high resolution characteristic of Landsat data makes it a great tool for monitoring, tracking, and documenting changes occurring on Earth’s surface. These changes could range form land use and urbanization, to wildfires and drought, to river patterns and animal grazing. Landsat images are incredibly useful for geographic analysis because they inform us the of the current state of the world and point us in a direction to make decisions, draft policies, and bring a positive change to places near or far. For example, a team of researchers could use Landsat images to examine the impact of hurricane Maria on Puerto Rico and identify areas that need immediate attention in terms, let’s say, high landslide risks. Alternatively, it could also be used in conjunction with GIS analysis to pin point the most optimal locations for setting up resource distribution stations because so many people are suffering from a lack of access to roads, telecommunication, food, water, medical kids, sanitary products etc.