Monthly Archives: April 2016

Final Project

Our final group project centred on the potential for new development of backcountry huts within the Pemberton-Lillooet area. As this area is well known for a wide range of sporting, leisure and tourism activities it is a prime area for a new hut to be constructed. Therefore all areas which followed this criteria were deemed acceptable for construction:

  • The hut must be at an elevation between 1,200 and 1,800m above sea level.
  • The hut must be at least 2km away from an existing hut.
  • The hut must be within walking distance (less than 2km away) of a peak higher than 2,200m.
  • The hut must have scenic views (must be less than 500m away from a lake).

These criteria were mapped and we were then able to determine which areas within the suggested region were suitable for development. The group report can be found here.

Group projects are always a challenge, but we designated everyone enough work to do so that no-one was massively freeloading on everyone else. A couple of us took part in taking the idea to a place where it was usable (i.e finding the correct data to use and modifying it so it could be used). Then others took the construction of the map, which took two lab sessions to fully complete. Afterwards, the write-up of the project was split up with people who had done more physical mapping taking less writing, while those who had done less mapping, wrote more.

Things I’ve learned from the group project

  • Never leave it all to the last minute- if you’ve got to hand it in in two hours time and a group member hasn’t gotten back to you with their section it can make the experience very stressful.
  • There is a large range of backcountry huts within the Pemberton-Lillooet region, which made finding similarities challenging, meaning that the criteria used may not be particularly great.
  • It was helpful that the TRIM data was on the geography departments system, so check first if UBC has the data you want before trying to download it yourself!


Lab 2- Spatial Data

Projection is the most important thing when mapping to get right. If not it can seriously affect the quality of the map produced. every map has a coordinate system, however due to the fact that the earth is spherical and a map will be a flat surface some system of projection is likely to have occurred. however during projection changes, the shape and size of polygons and line, and the angles between these entities will likely change. This means that a coherent map, with every layer displaying features in the correct place, will have all its features projected to the same coordinate system. However, ARCGIS has a feature which allows ‘projection-on-the-fly’. Projecting-on-the-fly is useful within ArcMap in order for different data sets that have been recorded on different coordinate systems to be combined without actually changing much of the data. Projecting on the fly can work on new versions of GIS, but anyone with older software is likely to struggle with the ‘on-the-fly’ projection, making the map unreadable and therefore unusable.


Also during this assignment, I worked with  vector and LANDSAT remote sensing raster data. Using remote sensing layers can be useful as it shows the exact satellite image from the area, giving rich, interesting information which is hard to display with vector data. Furthermore LANDSAT remote sensing has been operational for a large amount of time meaning that long term comparison of a changing environment can be shown.

During this assignment:

  • I gained understanding of the importance of projection with maps, and how poor projection practices can lead to maps that show completely the wrong thing.
  • Gained hands on experience with the process of changing projections within ARCGIS.

Lab 5- Environmental Assessment of Squamish Ski Resort

In the final lab, we were asked to take on the role of a natural resource planner, creating maps of the proposed project area for the British Columbia Snowmobile Federation (BCSF), a group opposed to the ski resort. Two maps were created, one of the natural land use of the Squamish area, and one of the Hillshade of the region. These maps would be useful in the planning stage of the resort, where local officials could veto the plan, if they were sufficiently concerned about the impact on wildlife.

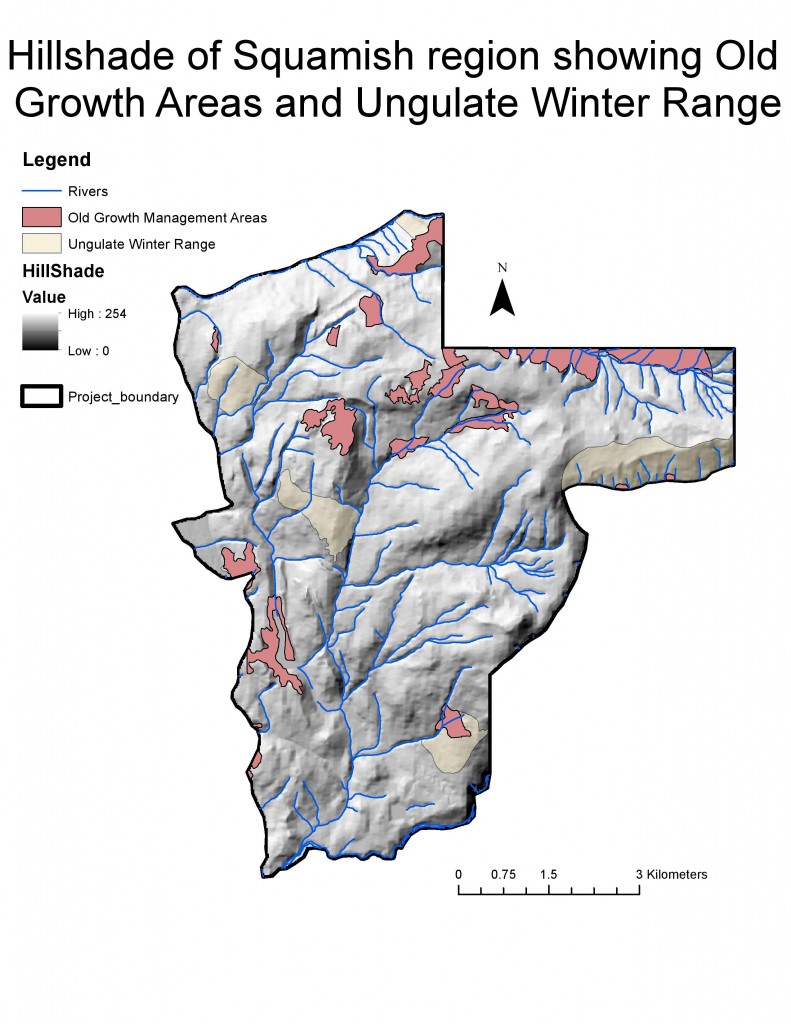
 

Squamish Map 1-page-001

Squamish Map 2 (1)-page-001

‘I was approached by the British Columbia Snowmobile Federation to create a viability map for the proposed site for a new Ski resort in the Squamish region.

Based on the research conducted it is my recommendation for the ski resort to not be built in the proposed area. Firstly, over 30% of the proposal area is under 600m elevation which will likely not experience a sufficient amount of snow, a major challenge for a ski resort. If there was a lack of snowfall then snow may have to be brought in from elsewhere which could be damaging to local ecosystems and environments. Secondly, over half (52%) of the project area is situated within areas of endangered wildlife, including old growth management areas, ungulate ranges, endangered fauna areas and fishery buffers. Putting a ski resort in an area where construction in over half of the area would have major impacts on the wildlife is untenable.

In order to create this map, data was collected from Statistics Canada, and was cut to size- meaning that only the area of the project boundary could be seen. Afterwards the elevation was split into two groups (above and below 600m above sea level), in order to separate ‘snowy’ from ‘non snowy’ areas. Afterwards, each individual area of habitat with the same species in it had to be collated together, excluding non-endangered habitat and only including the endangered areas. Once the ungulate range and old growth management areas were added to the map, only the fishery areas remain missing from the map. In order to create a buffer of 50m upstream and 100m downstream a series of selection functions were used to find the areas which fulfilled this requirement. Once these were coalesced together the buffer could be also added to the map. Finally, the addition of roads, contour lines and the park boundary completed the functional map, with a legend, title and north arrow added for clarity.

In my opinion the two greatest environmental concerns in the proposed area are the impact on fisheries and the impact of endangered species. This is because between the two, they contain approximately 30% of the total proposed area, and any development will almost certainly be unable to not impact 30% of a proposed site. In order to potentially reduce the environmental impact fences could be placed around these areas to make sure that no construction can occur and damage them. However, rivers are very susceptible to infiltration to construction must take care to not contaminate/pollute the rivers and streams within the proposed area.

Overall, I think it is very challenging to mitigate against any of the negative impacts of the proposed ski resort and therefore it should not be built, as it poses a large risk to the environment and to the ecosystem as a whole.’

This memo would be useful in informing local officials that in the proposed region there will be damage to ecological systems and services and that it is too high a price to pay for a ski resort. However, there is an interesting question relating to ethics and data. Sometimes, due to employment situations you may have to provide an assessment that you morally disagree with. Despite this thought, I agree totally with the memo’s findings. If over half of a proposed construction area is in vulnerable ecosystems, then it seems ridiculous to keep going with the project.

To conclude, during this project:

  • I used multiple ARCGIS features in tandem, including queries, proximity analyses and polygon overlays, in order to create a map of the natural land use in the Squamish area.
  • I made an informed decision, after consulting my data and maps, giving an accurate concise summary of the issues with a Squamish ski resort.
  • I evaluated the ethical and moral issues of environmental assessments and project viability analyses.
 

Lab4-Housing Affordability in Vancouver and Ottawa

The cost of accommodation is always a contentious issue in developed countries. However, in Canada, and in Vancouver especially, it is one of the most important local issues facing working people. In order to explore the issue, house price maps of Vancouver, using census data were created, with each data classification type used, in order for them to be compared and analysed .


dataclass-page-001 (1)

Each data classification type has positive and negative features relating to the displaying of data, with different uses depending on the map’s user. If I was a journalist, reporting on house prices in Vancouver, I would probably use the ‘natural breaks’ map for a couple of reasons. Firstly, from a visual standpoint, there is more red in the natural breaks map which means that at a glance the reader will believe that a large amount of Vancouver has very high house prices, as many people will not read the scale, or will fully understand it. This would complement a newspaper article about extortionate prices across the city.  Alternatively, if I was an estate agent, I may use the equal interval map to indicate to prospective buyers that the UBC area is much more expensive than the rest of Vancouver, indicating a rapid moving housing market. This may put some buyers off, however it may attract others who which to invest in a growing (in relation to house prices) part of the city.

However, there is a real question about the scale of house price inflation in British Columbia in relation to the rest of Canada. In order to see if house price inflation is just a west coast problem, Vancouver was compared to Ottawa.

HousecostVO-page-001

The map above shows that, on average, house prices in Vancouver are much more expensive than in Ottawa. However, there is an important factor to take into account: Affordability. The affordability of house prices relates a cost of a house compared to the average wage in each census tract. The map below, shows this affordability, which again highlights the fact that Ottawa is by far more affordable to live in.

affordability-page-001

This obviously indicates that Vancouver is far less affordable than other eastern Canadian cities, however it does not give an obvious indication about other factors such as livability. The quality of life for Vancouverites may be worth the lack of affordable housing, and in Ottawa, it may be cheap but unlivable. However it can not be said that Vancouver is an affordable city to live in!

To conclude, during this assignment:

  • I used ARCGIS to understand the importance of the classification of quantities, and that different data classification styles should be used for different reasons.
  • I constructed three maps, using ARCGIS, to display a wide range of data, including the average house prices in both Vancouver and Ottawa.
  • I evaluated the affordability of both Ottawa and Vancouver and argued about the factor’s importance in the house price debate.

Lab 3-Creation of a tsunami hazard map of Vancouver

Tsunami Vancouver Risk Complete Map

The map above shows the metro Vancouver area, and its vulnerability to a large tsunami. It shows that 15.5% of metro Vancouver is vulnerable to a 15m high wave crashing against the Vancouver coastline. In this scenario, five education or health facilities would be under threat:

  • Broadway Pentecostal Lodge
  • Coat West Community Hom
  • False Creek Residence
  • Villa Cathay Care Home
  • Yaletown House Society

During this assignment:

  • I evaluated the role of stylistic choices in map design, such as colour, density of entities, and types of legend.
  • I gained experience in using ARCGIS and its functions to utilise different tabular data sets, in the creation of a hazard map of the Vancouver metro area.