Initially, the task was to select four different cities within a Euclidean distance of 10 to 20 kilometers from the UBC campus. Settling on Vancouver, Burnaby, Richmond and Surrey, we used car crash data from ICBC along with lower mainland shapefiles, road networks and land use data to showcase the safest driving routes from these cities to UBC and vice versa. The method of analysis involved, first, data clean up prior to creating a cost surface, then selecting points in each city as a destination, before doing a kernel density analysis and creating a cost distance surface which is used to form the shortest, safest path from each city to UBC.
I. Data Clean Up:
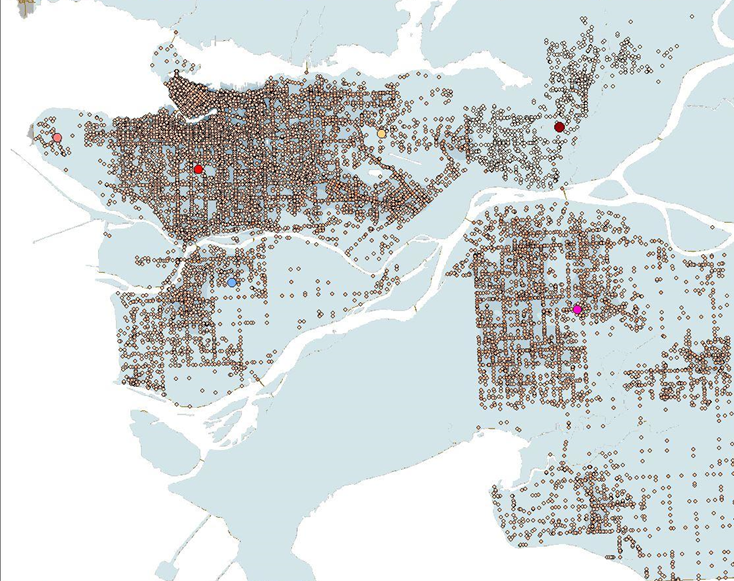
The first step was to ensure that all the layers had the same spatial referencing. So, the projections were all changed to BC Albers and the datum to NAD 1983 UTM Zone 10. The layers were then added to the car crash data shapefiles creating the output layer. This was made into the main geodatabase. Then, the excel car crash data was imported into ArcMap and converted into a points layer in the geodatabase, using the command make xy event layer. Since this spatial referencing did not match, so the projection needed to be defined. We inputted the spatial referencing as WGS 1984 because the longitude and the latitude was measured in decimal degrees and we needed to convert it to meters in ArcMap for the car crash data shapefiles. At this point, other municipalities, that we did not intend to look at, also had data. So, those data points needed to be deleted while in the layer editing mode. The same was done for the roads that were outside of the Lower Mainland area prior to intersecting the layer to the main project layer.
II. Creating a Cost Surface:
Now, with the data organized, spatial analysis can begin. The cost factors were then defined, by assigning frictional values depending on frequency of car accidents in a location.
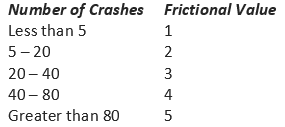
Another set of frictional values were also added in for the severity of the car crashes.
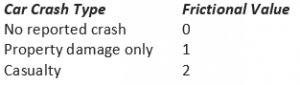
Also, the roads layer was converted into to a raster file and cost values were assigned based on if the pixel was part of a road (value of 1) or not a road (value of 0). During the processing, it was important to ensure that the calculations are restricted to roads (and do not incorporate waterways).
III. Selecting Source and Destination Features for the Route:
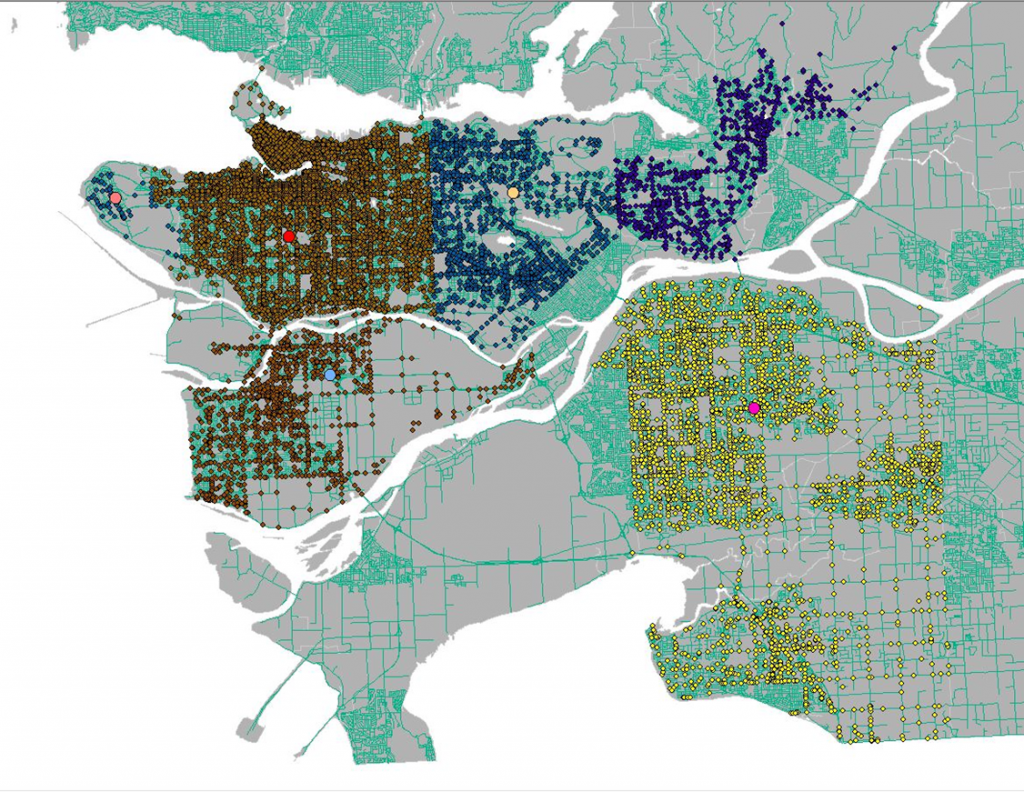
Since we did not have data on which specific neighbourhoods most people commuted from, an arbitrary point in each city was selected as a destination feature to avoid biases. This was done by doing a definition query, choosing points in layer editing mode, and deleting all other points that were not used. Once this was done, all the points in the different municipalities were merged into one layer.
IV. Creating Cost Attribute:
The next step was to create a cost attribute by creating a new column in the attribute table that considers both the weight assigned to the number of crashes and the crash type. This was represented by seven classes in a gradient.
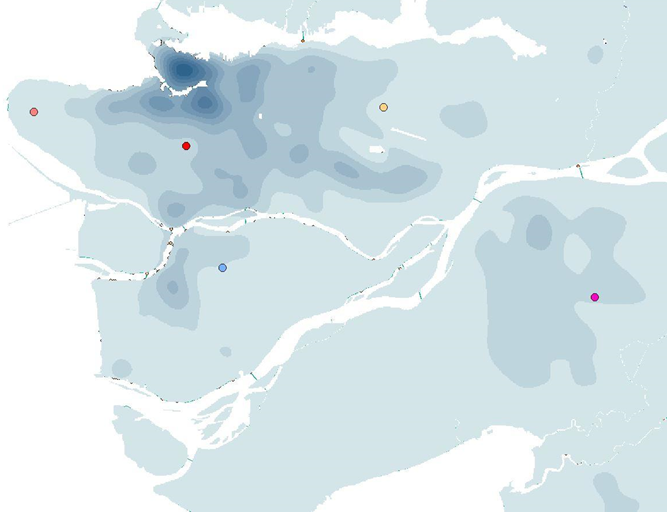
After this, a kernel density analysis was performed.
V. Creating Cost Distance Surface:
Next, we needed to create a cost distance analysis based on the new combined attribute that was made in the previous step. We created, not only a cost distance raster layer, but also the backlink raster layer as well.
VI. Creating Shortest/Cost Path:
Finally, with the cost distance surface layer, we were now able to make a path that outlined the shortest distance from our arbitrarily selected point in each of the four cities (Richmond, Vancouver, Surrey and Burnaby) to the UBC campus. Taking into account the ICBC data on car crash severity and frequency around the Lower Mainland, these four paths are the safest driving routes for commuters going to UBC.
Next section: Results and Discussion