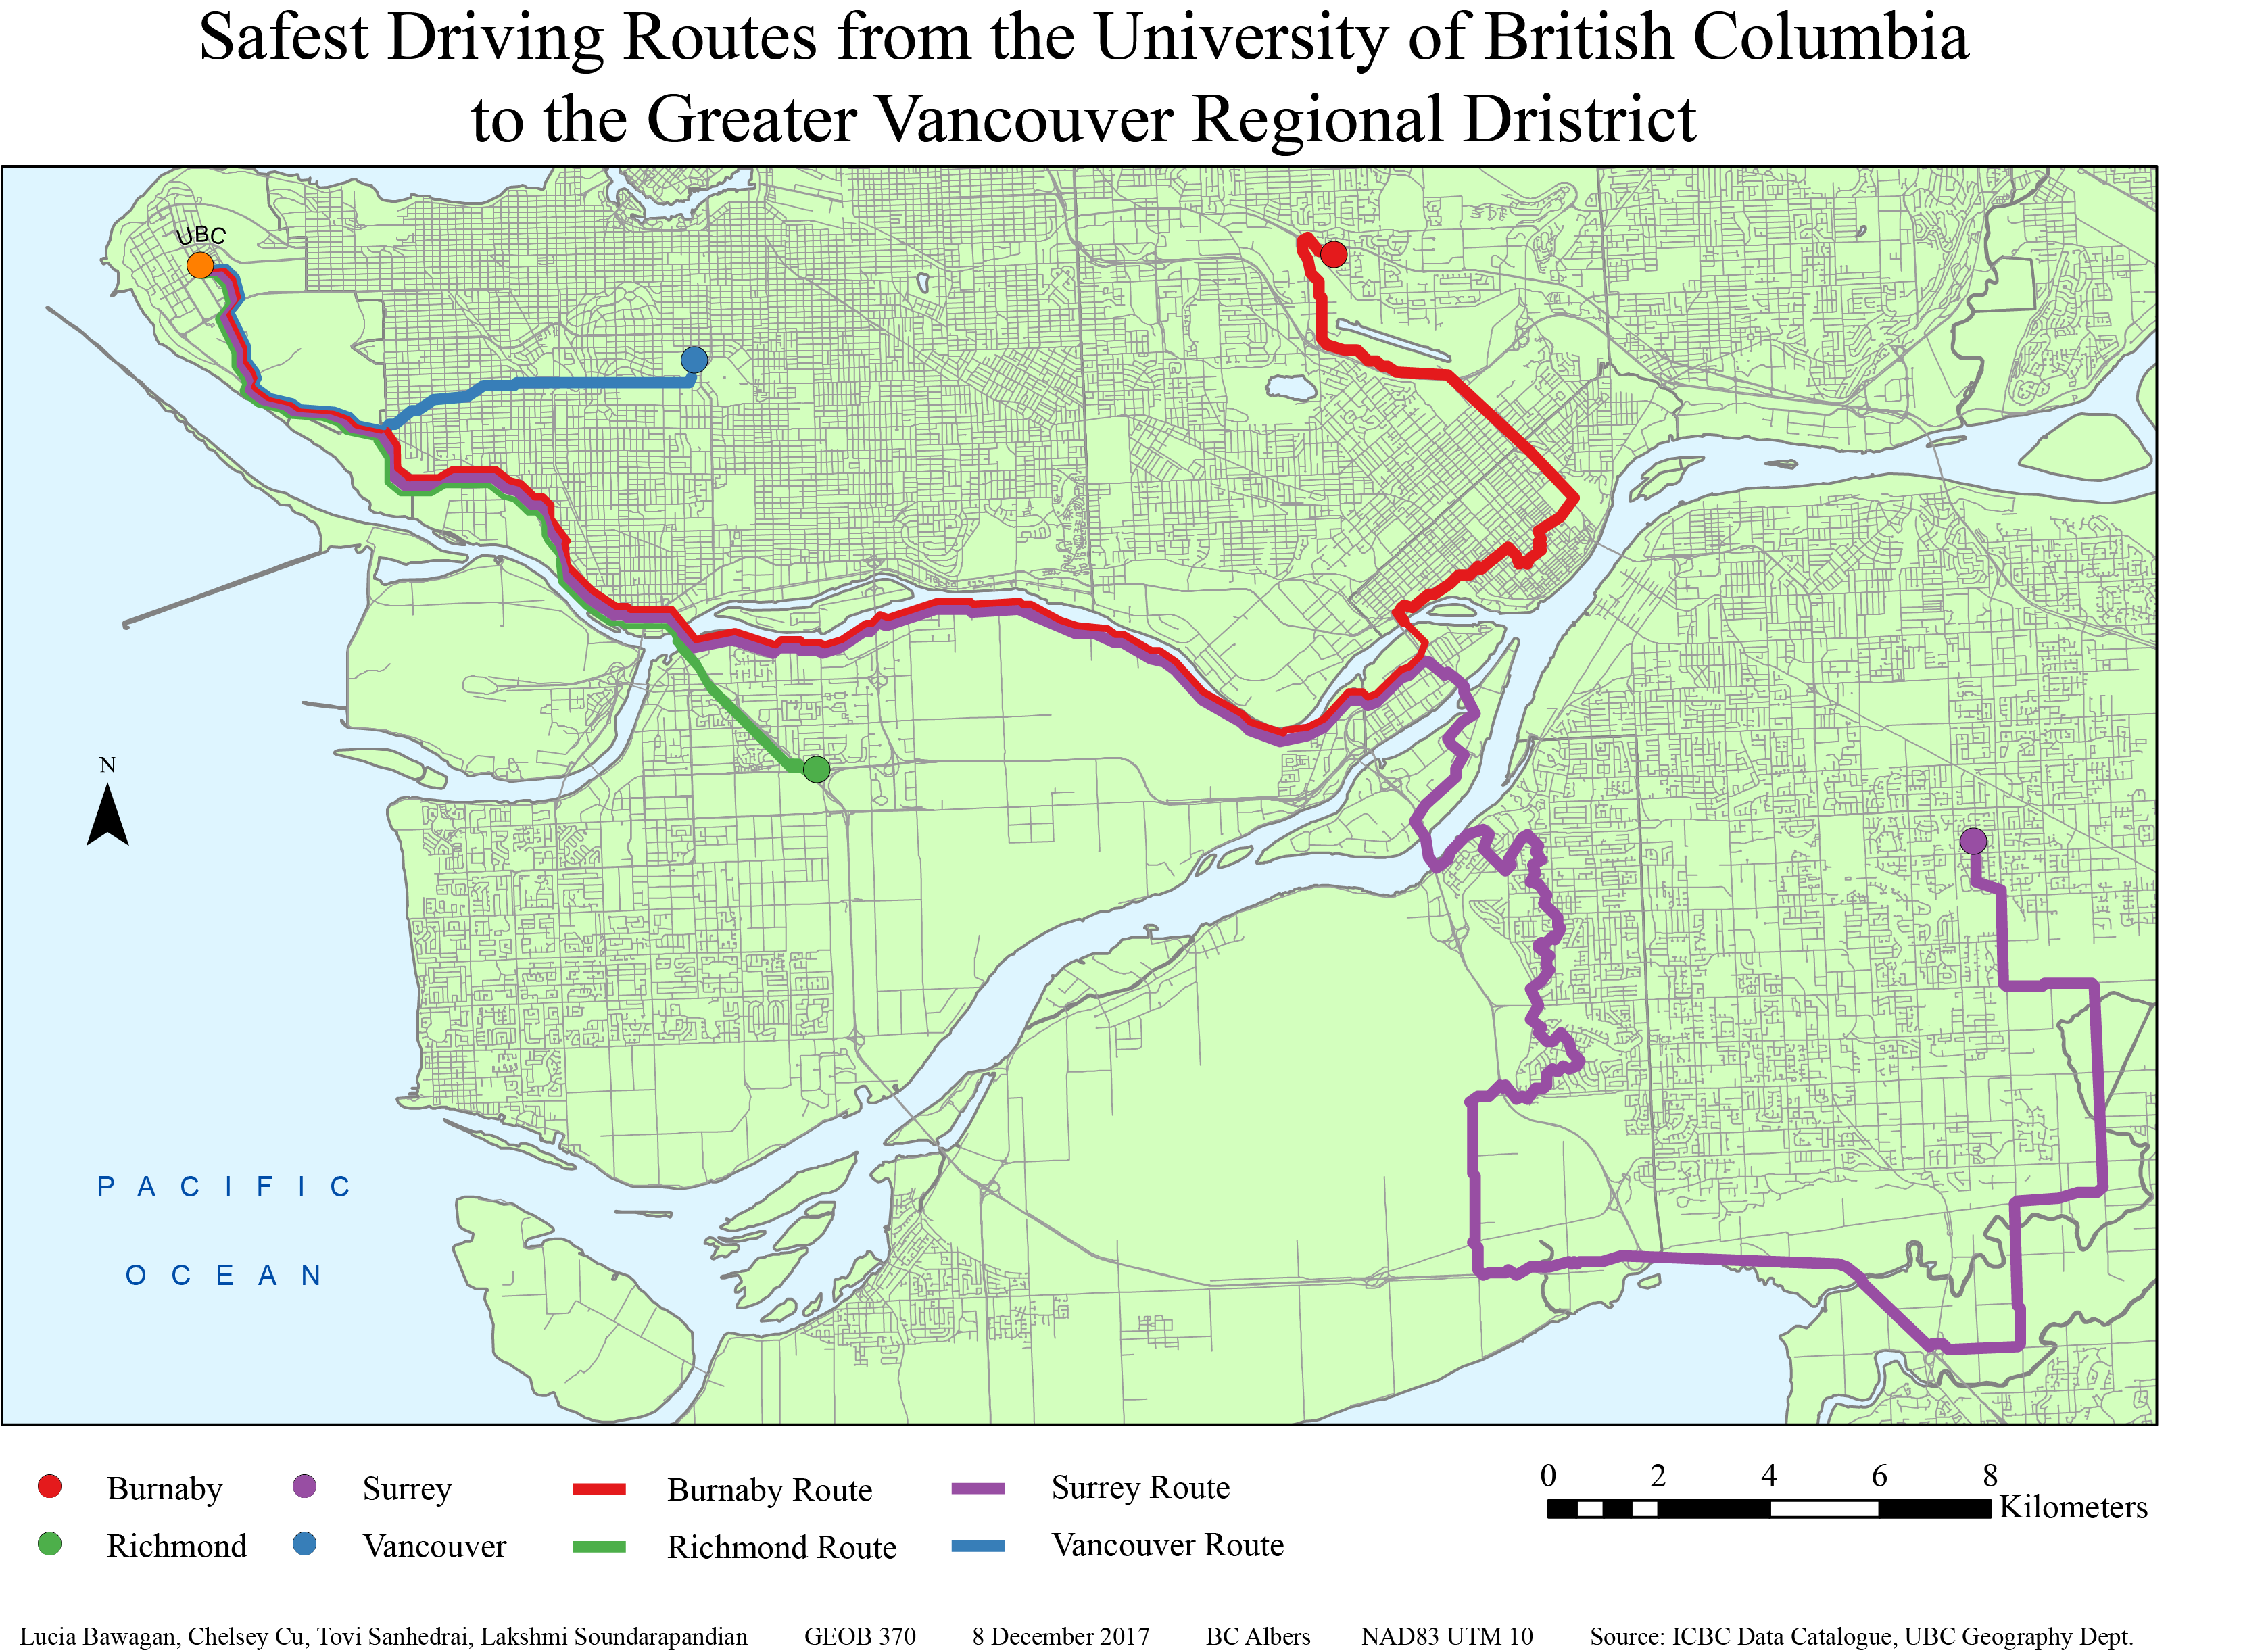
The results of the project are shown below in figure 4. Or, the map can be downloaded as a pdf by clicking here.
Based on the kernel density mapping of the ICBC crash data, all of the routes to the four residential areas head south and then east due to the high density of accidents northward of UBC. From looking at the routes, it can be estimated that there is a correlation between high density traffic areas and accidents. The routes tend to avoid major roadways in the municipalities whenever possible and veer towards less dense networks. Thus, it could be possible that main roads are more prone to accidents because of the higher volume of drivers using them. The routes outlined by the analysis is potentially a longer route from UBC to the destination in either Burnaby, Richmond, Surrey or Vancouver. This is because the analysis uses the ‘least cost’ path (which was designated by the car crash severity and frequency in a specific area) and there is a much higher density of crashes north of campus around Downtown Vancouver/ Kitsilano area.
Our analysis can be applied to commuter everyday life in multiple ways. It can increase the awareness of the safest driving routes between the UBC campus and the different cities in the Lower Mainland. For instance, given this information, drivers can be proactively be more alert and cautious when passing by the areas that are prone to accidents. This will encourage overall safer driving practices within the GVRD. Drivers can also avoid these areas whenever possible in order to minimize their commute times.
We would like to acknowledge that there are also points where our analysis falls short. For one, the point destinations were arbitrarily chosen rather than based on statistical analysis of which neighbourhoods most commuters are from. Furthermore, the classification of crash counts and risk levels were also arbitrarily chosen. In addition to this, there are also infinite combinations of cost by type and count when creating the ‘sum of the cost’ attribute. These errors and uncertainties could create uncertainties in our analysis and leave room for future improvements.
Next section: Further Studies