
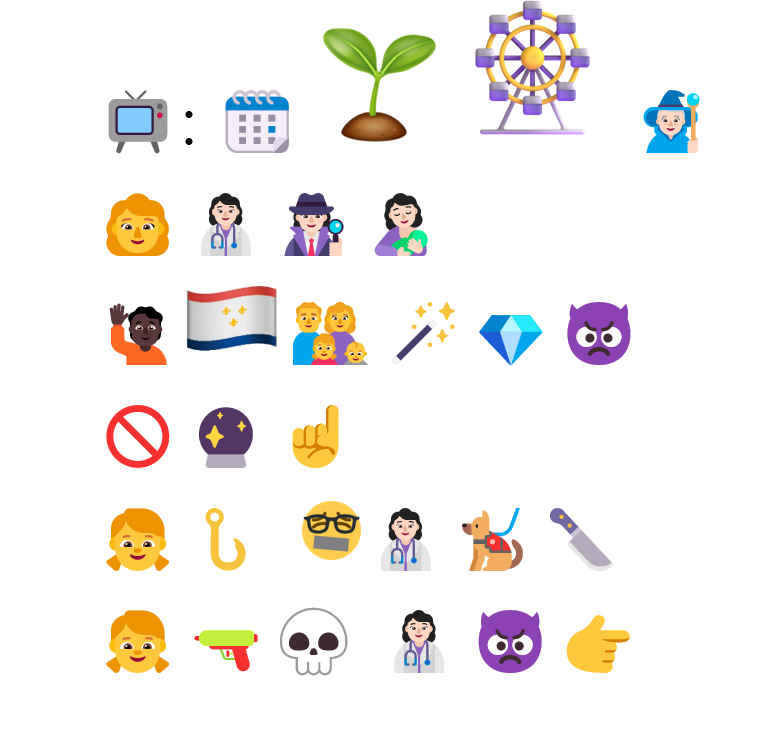
The biggest challenge for this task was finding the appropriate emojis. Even when entered into my post, this platform does not want to support them and all I got at the end was lines of question marks. I finally had to screenshot the word document to create a .png and upload it onto the page as an image (is this an example of the breakout of the visual?).
The challenge of trying to find the symbols (emojis) for what I wanted to convey was the first hurdle to get over, as there wasn’t the exact emoji for what I wanted to represent, so I had to search all over the place to find what I wanted. I also found that, just like a library literature search, you had to carefully define your terms, as many of the things I wanted to find didn’t seem to exist. This process is, I think, similar to the challenges in making graphics or visuals on a page accessible by providing alternate descriptions in written form, like Ekphrasis that Boltor (2001) notes. Trying to summarize a picture, image or symbol into written words is a challenge in itself, and part of the reason why we use graphics and symbols to convey concepts or ideas. To then have to summarize in words the image being presented is an extra layer of complexity and challenge that needs to be accounted for in our more visual culture.
I found that what Gretchen McCullough stated in The Allusionist podcast (Zaltzman, 2019) about needing emojis to provide context for tone when communicating by writing are used extensively in our digital culture, in emails and texts. Bolter (2001) reiterated this thought in his chapter discussing graphics, text and ASCII (p. 72). However, when trying to convey a complete story in pictograph format, things get lost in translation, and are also grounded in the culture in which you are communicating. Engelbart (1963) discusses symbology to represent concepts and the difficulties in doing so in the absence of written word symbols. As Engelbart (1963) writes, “a lack of words for some types of concepts makes it difficult to express those concepts…” (p. 13).
This visual outbreak has influenced culture in many ways. For example, I use PowerPoint a great deal in my work. Some of the principles in effective powerpoint presentations are to limit the number of words on a “slide” and use images more (Phillips, 2014). This is yet another demonstration of how visual representation has overtaken media, pedagogy and business.
I also found that I ordered my visual representation in the same way that I would a written text, from left to right in a line, then back to the left for the beginning of the next line and so on (Kress, 2005). I was looking at representing ideas and concepts rather than individual syllables or words. Even starting with the title, as like a chapter heading, is an example of trying to translate the written format conventions into graphic representations.
References
Bolter, J. D. (2000). The breakout of the visual [E-book]. In Writing space: Computers, hypertext, and the remediation of print (2nd ed., pp. 47–76). Lawrence Erlbaum Associates. https://doi.org/10.4324/9781410600110
Engelbart, D. (1963). Chapter 1: A conceptual framework for the augmentation of man’s intellect. In P. Howerton & D. Weeks (Eds.), Vistas in Information Handling (Vol. 1, pp. 1–29). Spartan Books. https://www.dougengelbart.org/pubs/papers/scanned-original/1963-augment-133183-Conceptual-Framework-for-Augmentation-of-Mans-Intellect.pdf
Kress, G. (2005). Gains and losses: New forms of texts, knowledge, and learning. Computers and Composition, 22(1), 5–22. https://doi.org/10.1016/j.compcom.2004.12.004
Phillips, D. J. (2014, April 14). How to avoid death by PowerPoint [Video]. YouTube TEDx. https://www.youtube.com/watch?v=Iwpi1Lm6dFo&feature=youtu.be
Zaltaman, H. (2019, July 13). New rules (season 1, episode 102). http://theallusionist.org/new-rules