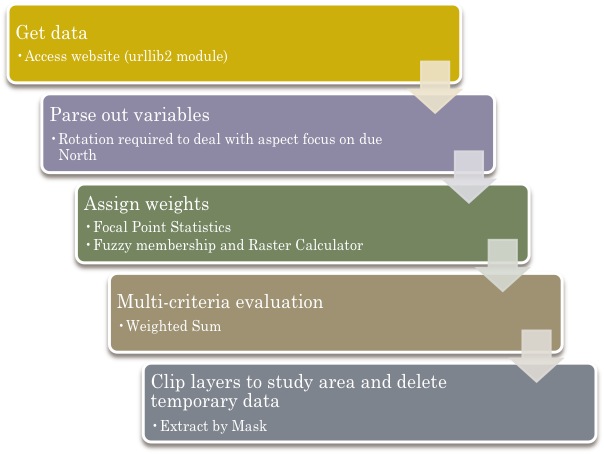
Avalanche hazard is a continuously varying phenomenon depending on recent weather trends and taking into account terrain and snowpack history. For this reason it was decided that an automated GIS tool to update hazard level in real time would be most useful. This was accomplished using a Python script for ArcGIS. The basic function of the script is highlighted below, and the full code can be seen here.

General algorithm used by python script for updating avalanche hazard in ArcGIS.
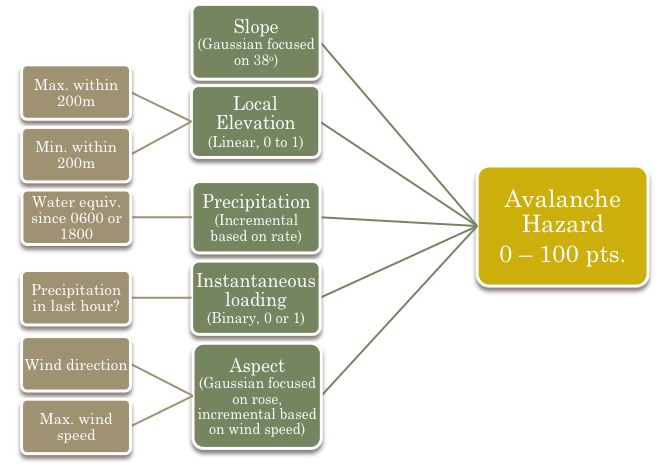
Fundamental to the measurement of avalanche hazard is a multi-criteria evaluation (MCE) that takes into account what is necessary to cause an avalanche as well as some potential perturbing factors such as precipitation and wind loading. Without access to historic data at a particular weather station the current model only considers immediate conditions reported at an hourly interval. A time history of precipitation is available from either 6:00 or 18:00, but is by no means adequate in developing the full weather picture. The diagram below outlines the factors used in constructing the MCE and a first take at the weight given to each factor. Brown elements are inputs from either the weather station or GIS model. Green are the variables considered and for each 30m by 30m cell in the GIS grid are given a value between 0 and 1 based. The areas under consideration are those that are above tree line or in an avalanche path, only a limited number of which were digitized from satellite imagery. Simple linear, normal and stepwise functions were used to assign the value. These variables are then scaled according to a weighting scheme shown to arrive at a final avalanche hazard score 0 to 100. These values are all preliminary and are subject to the critique of avalanche professionals.

Overview of the multi-criteria evaluation (MCE) used in evaluating avalanche hazard.
All of which is performed within ArcGIS. Requisite to scoring process is the weight given to each of variables as shown in the MCE above. The maximum of 30 for precipitation rate and aspect (which is derived from wind rate) is an incremental scale. At this point in time an arbitrary stepwise scale is used as presented below.
| Precipitation Rate (100 * km/hr) | Wind Rate (km/hr) | |||||
| Low | High | Score | Low | High | Score | |
| 0 | 0 | 0 | 0 | 0 | 2 | |
| 0 | 20 | 6 | 0 | 5 | 6 | |
| 20 | 40 | 12 | 5 | 10 | 12 | |
| 40 | 60 | 16 | 10 | 15 | 16 | |
| 60 | 80 | 24 | 15 | 20 | 24 | |
| 80 | above | 30 | 20 | above | 30 | |
