This tool is far from finished. In the current state it is capable of producing an ArcGIS raster that gives an avalanche hazard score from 0 to 100. However, this score is unreasonable and loosely based on the authors limited understanding of weather and avalanche conditions. In addition, the weather data used in the tool is extremely limited in scope and does not accurately represent the weather history. No consideration is given to snowpack, one of the three main components of an avalanche. It does however integrate terrain variability and generates a localized avalanche prediction. With access to greater information and the input of avalanche professionals to fine tune the weighting algorithm, a reasonably accurate tool can be constructed.
The first consideration would be gather longer term weather data. The time history used in the precipitation rate is attached to the 6:00 and 18:00 marker leading to measurements that are as short as a single hour. If snow had been falling intensely for hours prior to 6:00, but stopped when the weather station counter reset at 6:00 the current model would read this as 0mm/hr of precipitation and give a false negative hazard rating. This can be avoided by looking at larger time periods. Some weather stations in BC, such as those in Glacier National Park, report 24 hour weather history. A further improvement on this would be to have access to the BC government database where all Crown weather station data is stored.
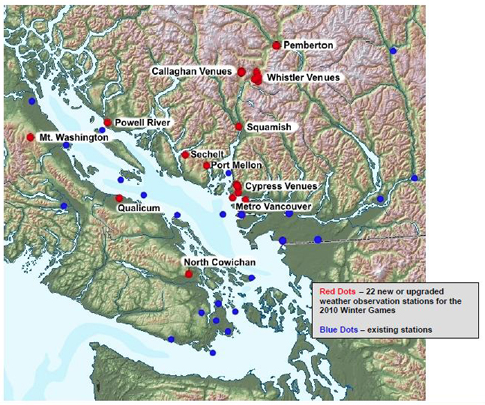
With a better understanding of the weather greater complexity can be introduced to the model. Consideration can be given to weather trends, such as rapid warming or cooling which can affect the stability positively or negatively depending on existing conditions. An aspect of spatial variability can also be introduced. Pictured below is the network of weather stations introduced along Highway 99 between Vancouver and Pemberton for the 2010 Winter Olympics. With this extensive dataset interpolation can be performed between locations to gain insight into what is occurring away from the instantaneous weather station.

Overview of the weather station network in the BC Lower Mainland developed for the 2010 winter games. Image taken from Environment Canada website.
Greater effort must also be given to vertical extrapolation. Temperature, precipitation rate, wind speed and possibly direction all change as a function of elevation from the point of measurement. This must be accounted for to predict hazard at elevations well above the weather station. In the case of wind speed and temperature it may be as simple as a linear relationship.
Accompanying a better understanding of the current weather, its location and history, judgments can then me made in terms of snowpack. For example a flag can be introduced in the algorithm for periods of warm sunny days that may result in a sun crust on the surface of the snow. If this is followed by rapid loading of new precipitation the avalanche hazard should increase until conditions can be verified. The history also allows for an understanding of total snow depth which is a necessary input for understanding any crystal metamorphosis that occurs within the snowpack contributing to stability.
There is an infinite amount of variability and complexity that can be introduced to such a model. The purpose as seen by the author is not to have a definitive answer to where hazard and risk exist, but to give the user a tool to better understand the spatial variability of terrain, weather and snowpack and therefore avalanche potential. The accuracy of the resulting tool will depend greatly on the amount of information available but more so on the critique of people who work with avalanches on a daily basis in the lower mainland. Hopefully, a more robust model can be developed and validated by comparing predictions to avalanche observations taken from the field.
