Korean Urban Sprawl

“Urban sprawl refers the disorderly and less regulated expansion of housing, and industrial and commercial developments in and beyond the periphery of metropolitan areas.”


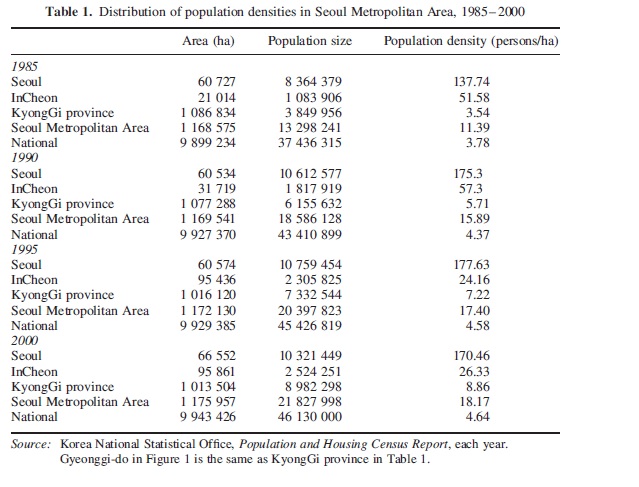
In 2000, less than 50% of national population stayed around SMA. The ratio Seoul to SMA was 62.9% (8364379/13298241) in 1985, the ratio became down to 57% (10612577/18586128) in 1990 and 53% (10759454/20397823) in 1995 and 47% (10321449/21827998) in 2000. Seoul population decreased. It was due to the deregulated land development and high demand of housing around SMA. The results of high density of SMA caused negative externalities: traffic congestions and environmental pollution.


Korean government set the zoning system. Its aim was to regulate land development and to maintain balance in development between residential land and agricultural land. As well, in 1971, The Seoul and SME governments which were InCheon City government and KyongGi province organized “two tier systems”. These main administrates played role in ‘upper tier government’, and they were governed by local administrations and established Urban Planning Act (UPA). Under the UPA, local governments simply investigated whether the land developer followed the certain rules for development. According to Cho (2005), he stated that the UPA was essential mechanism for urban growth. The UPA required land owners to strictly stick to the four types of zoning rules: “building height, setback, building coverage, and FAR”. As well 1972, the National Land Use Management Act introduced the National Land Use Planning Area (NLUPA) to control land use outside the UPA.

However there were several reasons how Korean urban sprawl began. In 1993, the Quasi Agricultural Zone (QAZ) was deregulated. It allowed 3 hectares of land to be 500% of the Floor Area Ratio (FAR). The higher % of the FAR referred to the high density of land usage. Usually residential lands had around 500% of the FAR. Thus it showed that 3 hectares allowed land developers to covert agriculture land into residential lands with high rise of apartment. In other words, the deregulation of QAZ increases the speed of conversion on residential land. Thus the ease regulation leads to lack of basic publicity on the land, and ends up urban sprawl.

The 1993 deregulation beyond the coverage of UPA attracted the conversion on land of rural area into residential area. Urban sprawl has been issued in Korea since early 1990s. The total number of conversion of urban and rural edge is over 500 times for 10 years. In KyongGi province especially “areas of YongIn, HwaSeong, and KwangJu, approximately 6% of conversion was found. The conversion of residential land in satellite settlements caused more severe urban sprawl. Cho (2005) claimed that especially the satellite area had lack of public system including sewage system, school, and road. It was quite difficult to support for the expense to the original land owners as taxpayers. They were mainly farmers who do not have strong financial states.

Furthermore, the purpose of the Housing Construction Facilitating Act (HCFA) was providing housing to people who do cannot afford it; however, HCFA under private sector provided housing with small units in less than 3 hectare in order to keep away from strict regulation. As a result, the residential area under HCFA which was under private sectors become scattered land development with lack of infrastructure and poor quality of public facility.

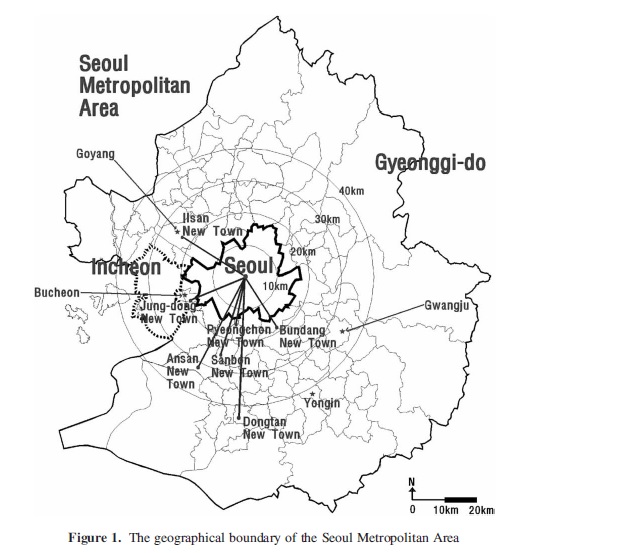
After 1960s, Seoul has been the heart of economic development in Korea. The centralized population around Seoul has changed to decentralized population with broad area of satellite; however it is inevitable that the Seoul Metropolitan Area (SMA) is consequences of urban sprawl. It is because of lack of public system and inefficient land development around the SMA.  -Seoul Metropolitan Area (SMA): Seoul, InCheon, and KyongGi province

Korean land development system transformed many times from regulation land development toward deregulation land system. The Korean land system was heavily dependent on private sectors rather than public sector. One reason was to satisfy the current and potential residential living in SMA. Since the demand is skyrocketed, Korean government chose to work with private sector rather than public sector.

For distribution effects of urban sprawl, I do not find paper to example about it. I think the land owner having land that converse from QAZ to QUZ benefits from increase land price. Low income family who cannot afford the housing cannot benefits from increasing housing around SMA. Middle income family who can afford the housing benefits from it.

To make efficient land development, implementing other policy can help reduce the urban sprawl in Korea. Cho (2005) criticized that Korean land system was not effective because development fees collected by local government benefits to land owners. As well he stressed that the fund would reduce the level of urban sprawl when the fees support public project of land development. As well, he stated that the private land developer should supply certain level of infrastructure.  Also in order to prevent scattered land development around SMA, it would be necessary that Korean government settle down in the land development instead of relying on private sectors and organized the results from the urban sprawl by implementing appropriate policy.


Cho, Jaeseong. “Urban Planning and Urban Sprawl in Korea” Urban Policy and Research (2006)

Kang, Myunggoo. “Understanding Urban Problems in Korea: Continuity and Change” Development and Society (1998)

The UK landfill tax

The UK landfill tax was introduced in 1996. HM Revenue and Customs of Federal Institution collect the tax. Initially the purpose of landfill tax was internalizing externalities regarding landfill; however, the tax rate had been too low. It is increasing in order to changing people behaviour.  In other words, the first goal was to add cost of externalities. Later, the goal became changing behaviour by increasing the tax rate. The landfill tax regulation covers most of waste such as soil, sand construction or inert residues, recycling residues, including Hazardous waste. The landfill tax regulation in UK leads to the incentives for better waste management.   I believe the landfill tax regulation works. I will explain how in detail later. Beforehand I want to show an example of Netherland. The country enjoyed high level of government revenue by levying tax on landfill waste. This results in improving the waste management and decreasing the volume of waste and decreasing in revenues. In the end, the ministry of finance in the Netherlands has announced that the tax from January 2012 was eliminated in order to ease the administrative system.  Likewise, I think UK taxation is necessary, but it is time to reduce the tax rate.

I talked what landfill tax regulation covers in the beginning, for the exemption of taxation, it includes “dredged waste from inland waterways and harbours; waste arising from mining and quarrying operations; the burial of pets; waste arising from clearance of contaminated land, waste used for the restoration of landfill sites, and waste from the filling of quarries” (1) In other words, it is waste coming from mining, harbour, and quarry.

Since the landfill tax implemented in 1996, there are two impacts we need to consider: the environment and the social impact.  Thanks to the landfill tax, the amount of waste landfilled has declined greatly. From 1998 to 2010 the overall landfilled has reduced to 46 million tonnes from 90 million tonnes. From 2001 – 2005 the amount of landfilled waste diminished by 5 million tonnes. As well, for the Economic impact, the tax provided large amount of government revenues. Even though the total waste landfilled has been reduced, the total amount of revenues has been increasing. It is because the tax per ton is also increasing. Thus we can conclude that the reduced landfilled refers to the success of chaining people behaviour. People become more aware of environment damage due to taxation of waste landfilled; on the other hand, we can put a question mark that it would be the time of decreasing the tax rate in United Kingdom like the example of Netherland where the tax rate decreased after the total amount of waste landfilled decreased.

The Tax is regulated by HM Revenue and Customs. When it is introduced in 1996, the tax was set at EUR10/t for active waste, and EUR 2.9/t for inert waste. In 2005 the tax for active waste was increased to EUR 26/t, and in 2008 to EUR 40.8/t, and in 2010 to EUR 54.1/t, and in 2011 EUR 64/t. In case of Inert waste, the tax is pretty much constant around EUR 2.9/t over 5 year. The amount of tax levy depends on whether it is active or inactive waste and the weight. Landfill tax is paid by ‘directly’ by the landfill operators. In order to pay the tax, the operators charge the landfill costs including taxes to local businesses and councils.

The purpose of landfill tax is funding landfill operator to support projects with environmental objectives. UK land fill tax credit purpose is same as tax. (Because I focus on Landfill tax, tax credit mentions once here). From April 2005, two thirds of the revenue allocated to Business Resource Efficiency and Waste (BREW) programme. “BREW was developed in consultation with business representatives, the Treasury and the Department for Business, Enterprise and Regulatory Reform (DBERR) and allocates funds to specific programmes such as Envirowise, the Waste & Resources Action Programme (WRAP) and the National Industrial Symbiosis Programme (NISP) to promote more sustainable waste management on the part of commerce and industry”(1). Based on what I research, the tax benefits are allocated to landfill firm instead of everyone who pays the tax. The specialized program might be beneficial to promote better environment management for landfill waste. Meanwhile, there is also possibility of high opportunity costs to maintain rather complicated administrative system

The landfilled waste tax definitely plays a role in decreasing the total level of waste and providing incentives for further development reducing waste. It was expected to decreasing in construction, demolition and excavation waste from 23 million to 12.5 million from 2008 to 2012 due to taxation. However, it is quite surprising that United Kingdom has been collected the highest revenue which is EURO 1200 million IN 2001 from landfill tax among Europe countries. Compared to France, where the number of population is similar to the United Kingdom, it collected revenue only Euro 259million in 2010. France collected the tax for General landfill Tax Euro 15/t and for General incineration tax EURO 7/t in 2009. I could not find direct marginal damage from the regulation taxation; however, by comparing data from other countries such as Netherland and France, the United Kingdom might need to consider of reducing tax in order to make it less the burden of paying greedy landfilled waste tax for business and local municipality in the United Kingdom.


Reference

1.http://scp.eionet.europa.eu/publications/WP2012_1/wp/WP2012_1

2.http://economicinstruments.com/index.php/solid-waste?start=40

3.http://www.soccerline.co.kr/slboard/view.php?code=totalboard&uid=1992866054


UK’s Climate Change Levy

Definition of carbon tax:

The tax is levied by taxing on the carbon content of fossil fuels such as gas, coal and oil. This leads to decreasing consumption on fossil fuel and reducing the level of greenhouse gas emissions.

Policy’s Political Origin:

The United Kingdom began its Climate Change Levy in 2001. The time the policy implemented was 10 years behind compared to other northern European countries

Coverage/exempt:

The CCL(Climate Change Levy) is ‘downstream’. It “is paid by energy users not extractors or generators, is levied on industry only, with households and transport being exempt”.  Non-renewable forms of energy such as nuclear power is not included as a category of paying the tax, even though the proposed tax would be a combination of tax on the carbon content of fossil fuels, and a tax of all non-renewable forma of energy.


How do these policy implement over time?


Climate Change Levy (CCL) is taxing on categories such as electricity, natural gas supplied by a gas utility, liquefied petroleum gas or other gaseous hydrocarbons supplied in a liquid state for heating, and solid fuel (e.g., coal and coke, lignite, semi-coke of coal or lignite, and petroleum coke). CCL rates only apply to industrial and commercial energy supplies to the industrial, commercial, agricultural, public and service sectors The CCL was designed to encourage businesses to become more energy efficient and reduce GHG emissions.

A study showed that by 2010 the CCL help reduce energy demand by approximately 15% in the commercial and public sectors. As a result, industry does not have to pay higher taxes


Cost-Effectiveness of the policy:

Examining the effects of a carbon tax alone on GHG emissions would provide a more precise estimation of policy effectiveness. Many governments model the effects of a carbon tax acting alone during the implementation phase of the tax. A research shows that the Climate Change Levy would decrease energy consumption by approximately 15% in 2010. However, it is hard to estimate the true impact of tax itself in the real life. In general, one argument can be drawn. It is the CCL administrative ‘simplicity’. Since the tax is levied ‘downstream’ it is not possible to identify the fuel sources the roots of belongings.


Distributional effects of the policy:

In broad picture, there are three ways to distribute revenue from carbon taxes: “directed specifically to carbon mitigation programs, or directed to individuals through measures, such as reductions in income taxes, or used to supplement government budgets.”(1)

Climate change program returns tax revenue to customers through other means such as income tax reductions. These “revenue-neutral” mechanisms let customer behavior to change while reducing other taxes and it does not necessarily require government to spend extra budget for emission reduction programs. The “double dividend” theory suggests that revenue-neutral policies results in two benefits: a price is applied to fields that harm the environment and income taxes will decrease. A revenue-neutral approach can also lower the overall economic impacts of implementing a carbon tax.

As more details, Climate Change Levy is downstream rather than upstream, so the electricity generators who are in charge of paying the tax have no incentive to switch to cleaner. And the coverage is restricted to households.


Personal Opinion:

I thought Carbon tax is not effective before I research on it. It is due to substitution effect. Products like gas and oil do not have many substitute goods. So its demand curve is quite inelastic. So even though oil price is increasing due to tax, it does not affect to reduce the consumption and reduce greenhouse gas emission. However after I read few articles, I think UK’s Climate Change Levy proves that it helps to reduce greenhouse gas emissions. However, I think there are still drawbacks. The policy need to exempt not only households who are classified as low income, but also other electricity generators who need to pay tax per unit of electricity. If they are given incentives, they will concern of reducing carbon emission. Also I think Climate Change Levy is downstream. It has the ambiguity of belongings. I think in order to saving administrative costs, it is necessary to make clarify the right sectors to pay the tax.

References:

  1. http://www.nrel.gov/docs/fy10osti/47312.pdf
  2. http://eprints.ucl.ac.uk/17288/1/17288.pdf
  3. http://search.oecd.org/officialdocuments/publicdisplaydocumentpdf/?cote=COM/ENV/EPOC/CTPA/CFA(2004)66/FINAL&docLanguage=En


How to make fishery markets sustainable

From the article “How Behavioral Economics Could Save Both the Fishing Industry and the Oceans” written by Eric Pooley, he elaborates that previously, fishermen have overfished because there are limits to catch fish in certain time, but he introduces  a new method to keep fishery market sustainable. It is called catch share management. He explains it works well by changing human behavior with putting incentives. It is mainly done by the fishery share, the maximum catch amount not time, determined scientifically. The share is based on the average amount of fish per year. The limit is not ‘tightened’ but ‘flexible’ for fishermen and consumers. The catch limit management helps fishery stock to increase at a given example in the Gulf of Mexico of red snapper fish. Also it helps to reduce the amount of discarded fish by 50%. Also other regions such as Northern California, Oregon and Washington State are along with the new method.

I enjoy reading the article. I think there is a question how we monitor each fisherment fish at the right stock. Also we learn in class that since the fish moves broadly, it is not easy to place under jurisdiction, so I hope many countries are cooperatively participated in fishing at a sustainable level.

http://blogs.hbr.org/cs/2013/01/how_behavioral_economics_could.html

9th week: Cool Sources


http://www.china.org.cn/

This website shows local and world news that are related to China. As china is one of large grain consumers, it is benefiticial that we can get information what happen to China.

http://www.foxnews.com/

This website is mainly dealt with news related to US. Also it is helpful to know world news. And we can also news video from the website, and it is updated very frequently, so we could read recent news.

9th week: The Road Ahead

The International Energy Agency predicted oil demand will grow at a slower pace. It is because the world economic growth rate is expected to slow, and the world oil demand as well. Meanwhile, global oil supply is increasing; however, there is uncertainty of Hurricane Sandy effect and Euro crisis. Thus oil price tends to fall or constants for a while.

Corn

I expect corn price will increase. The Environmental Protection Agency (EPA) says that it will keep in purchasing greater than a third of the nation’s corn to be converted into ethanol and blended into gasoline, so the demand for using ethanol will affect the price will go up. Also corn demand will remain high due to the animal feedstuff in China. The country needs 180 million tons of feedstuff this year which is 65 percent is made of corn

Wheat

I expect wheat price will go up. Russia, one of the world’s largest wheat exporters confront a supply deficit. The government plan to reduce the supply shock for domestic consumers, so it is trying to sell 1.25 million tonnes of wheat this year from its 5-million-tonne. But still wheat market is competitive. I think wheat price increase.

http://www.foxnews.com/world/2012/11/13/oil-falls-as-iea-predicts-demand-will-grow-at-slower-pace-next-year-due-to/

http://www.capradio.org/news/npr/story?storyid=165287910

http://www.china.org.cn/business/2012-11/18/content_27149412.htm

http://www.reuters.com/article/2012/11/14/grain-russia-idUSL5E8M74W020121114

8th week: Cool sources

http://www.nass.usda.gov/Publications/Reports_By_Date/2012/September_2012.asp

I mention this website form last website. This week I experience how important USDA report is. Traders make a contract by the time when the report released.  The crop report is so important to make a decision. This report explains how much actual crop will be traded in the market.


http://www.menafn.com/menafn/1093577664/Corn-traders-likely-set-for-more-mixed-price-signals

This website provides world headline news and financial information in the first main page. This website seems to be professional. This is website has many news from Arab. So this website deals with many news regarding oil and energy. The countries related to Arab such as US, China, Iraq. This web site also has its own research banner. For agriculture sector we can read article more in depth. For example, Gavin Maguire, one of writers explains the commodity market using terms of basis and the transport costs which we learn form 501 class. It was interesting to read article when I see how the terms actually are applied into real world analysis.


8th week: The Road Ahead

I expect corn and wheat price will be recovered, but soybean price will take time for recovery

Corn – USDA Report :Corn Production Up Slightly from October Forecast. Global supplies were estimated to increase crops, mostly due to larger stocks from Mexico and EU-27, and increased some are of U.S. production. However the corn production in U.S is damaged over the summer by the severe drought. So compare to last year, the supplies is not enough to satisfy the world demand.  According to Jim Gerlach, president of A/C Trading Co, he expects the corn market will be competitive because USDA did cut expected export volume for corn, so I conclude that the price will increase because of not sufficient stock.

Soybean- USDA Report: Soybean Production Up 4 Percent. It is because that increased rainfall helped soybean production and supplies. The report also states export volume will be increasing due to increased supplies. So the soybean price will be low.

Wheat-USDA Report: USDA Report said that U.S. wheat stocks were increased by 50 million bushels to 704 million. So the price decreased. However Global wheat supplies were estimated 1.9 million tons lower due mainly to decreased production in Australia. And Ukraine’s export ban also affects decreasing the supplies of wheat. so I think wheat price will go up because trade policy and weather affect the trade volume.


http://usda01.library.cornell.edu/usda/current/CropProd/CropProd-11-09-2012.pdf

http://www.forexpros.com/analysis/wasde:-corn-and-soybean-yields-increase-143016

http://online.wsj.com/article/DN-CO-20121109-010515.html


8th week: what went wrong

commodity Quantity Price in Initial position Price out Offset position Gain/loss
S2X 2 1513 long 1452 Keep (-$3,050.00)
W2Z 1 879.25 long 886.5 Keep ($737.50)
C2Z 2 744.25 long 749.5 Short $362.50
S2X 4 1515 long 1452 Keep (-$3,150.00)


This week I lose half of my equity. It was like the movie Trading Place….

I thought soybean will increase. I had 6 soybeans in my contract. I thought it would increase. One of major producer in Argentina was expected heavy storm, so planning process has been slow to be 4% from 9%. I thought the supply could not satisfy the demand. And as substitute effect, corn price would increase too. So I had two long positions on corn. However, after USDA report released, both soybean and corn price decreasing a lot. Especially soybean, even though the trading market was closed, the soybean price kept decreasing by 40. Luckily for corn I offset before that. I could make some money.  I hope that soybean price is recovered. If not, I think I will bring it to end of class.


I had one long contract on wheat. I expect wheat price increase. Overall I thought US presidential elections will make the commodity market more attractive. Also when I gather information from reading article, it says that world wheat market supply is not enough to support world demand. It is because an export ban policy from Ukraine implemented soon on 15th this month. The area of U.S. Plains, major US agriculture, has not been recovered from severe drought condition.  Australia for New South Wales is expected rain in time of harvest which affects world supply decrease. As my prediction, wheat price was increasing, but after report released, the price was decreasing little bit. I kept this week.

7th week: Cool Sources

http://www.bernama.com/bernama/v6/general.php

This website helps us to understand the price change by providing literature explanation. For example, this website illustrates what happen to Argentina after strong storm came. It says that due to storm, the planting day has been delayed to 4% from 9% last year of 19.7 million hectares. As a reader, it is easy to understand the storm effects on commodity by giving the reasons with specific numbers. The website title is Bernama refer to Malaysian National News Agency. It is built by Act of parliament in 1967, and it is monitored by Board of Governors. Bernama has office in Washington, London, Manila, New Delhi, Dhaka, Melbourne and Vancouver. Its goal is to provide reliable and latest news among local & international media including government agencies, corporations, and university students. It is interesting that many Malaysian newspapers, electronic media and even Federal Governors are BERNAMA subscribers. I think this website purpose is to educate people, and we could read commodity news and global hot issue.


http://www.ibtimes.com

The International Business Times show three commodity markets at once. On the market/finance section we can read commodity news. The have commodities market separately. So it is easy to read news. This website gives natural resource price change, and corn with ethanol price change.  The website is updated every day with different topics.