Category Archives: Uncategorized

Final Project Reflections

The purpose of our final project was to provide the City of Vancouver with a survey of the current state of bike lane infrastructure and to suggest improvements in order to improve bike lane infrastructure as the city moves towards its goal of Greenest City 2020. After acquiring data from a wide array of sources, we used ESRI’s ArcGIS program to create a series of visual representations of current infrastructure, income, bike usage, population, bike accidents and schools. After extracting key data, we performed visual analysis to determine that while current infrastructure serves those who already bike, improvements could be made to encourage more biking. We created six maps and included these in the appendices. As well, we chose to work together as a group to tackle this project, everyone contributed to the making of the maps as well as to the writeup.

This was an interesting project to work on together and I enjoyed working on a project that I could actually see being implemented in my city. I often travel along the bike lanes that we researched and so I was able to contribute practical knowledge to the creation of our maps and sources. Working on this project required a lot of communication and sharing of data and information. We found it best to each work individually while checking in with each other often, as this allowed us to use our own creativity in the project, which we could then share with others. We were lucky in that our data was easy to source and easy to access for everyone, I imagine that if you were using a more complicated dataset, it may be difficult to transfer the data among partners. Our data came mainly from the City of Vancouver database, which was a great help for us. We appreciated that the city is so open to citizen science and is willing to support it however possible. Finally, although I recognize that some of our suggestions are likely not feasible, such as dedicating one lane of Kingsway to bicycles, we have created a great database of information and data that can be drawn from in order to make decisions regarding the placement of further bike lanes.

Garibaldi at Squamish Environmental Impact Assesment

Memo

To: Northland Properities and the Aquilini Group

From: Emma Lodge of Big Sky Natural Resource Planning

Date: 2016-03-16

Subject: Garibaldi at Squamish project priorities and planning

The proposed Garibaldi at Squamish year-round resort, which will sit on Brohm Ridge (fifteen kilometers north of Squamish), has the opportunity to become a world-class recreation and commercial facility but attention must be paid in order to preserve the exquisite natural surroundings. While the project was recently approved, forty conditions were put in place to prevent or reduce any significant environmental, social, economic heritage and health effects. As lead Natural resource planner at the retained Big Sky Natural Resource Planning, I write to you today with my recommendations on most critical of these conditions in order to proceed in a way that is viable for your commercial development and the continued care of the natural environment.

In order to analyze the project and criticisms, we used advanced computer software to analyze the geographic and spatial data (ArcGIS). After collecting all the requisite data, we limited the data and maps to only the proposed area of 5472 HA. This then allowed us to use the software and our knowledge of the project to search the data for areas that would directly impact old growth forest management areas, ungulate winter habitats, red-listed ecosystems and fish habitats. See below for the steps taken and results.

Impacted Areas and Ecosystems

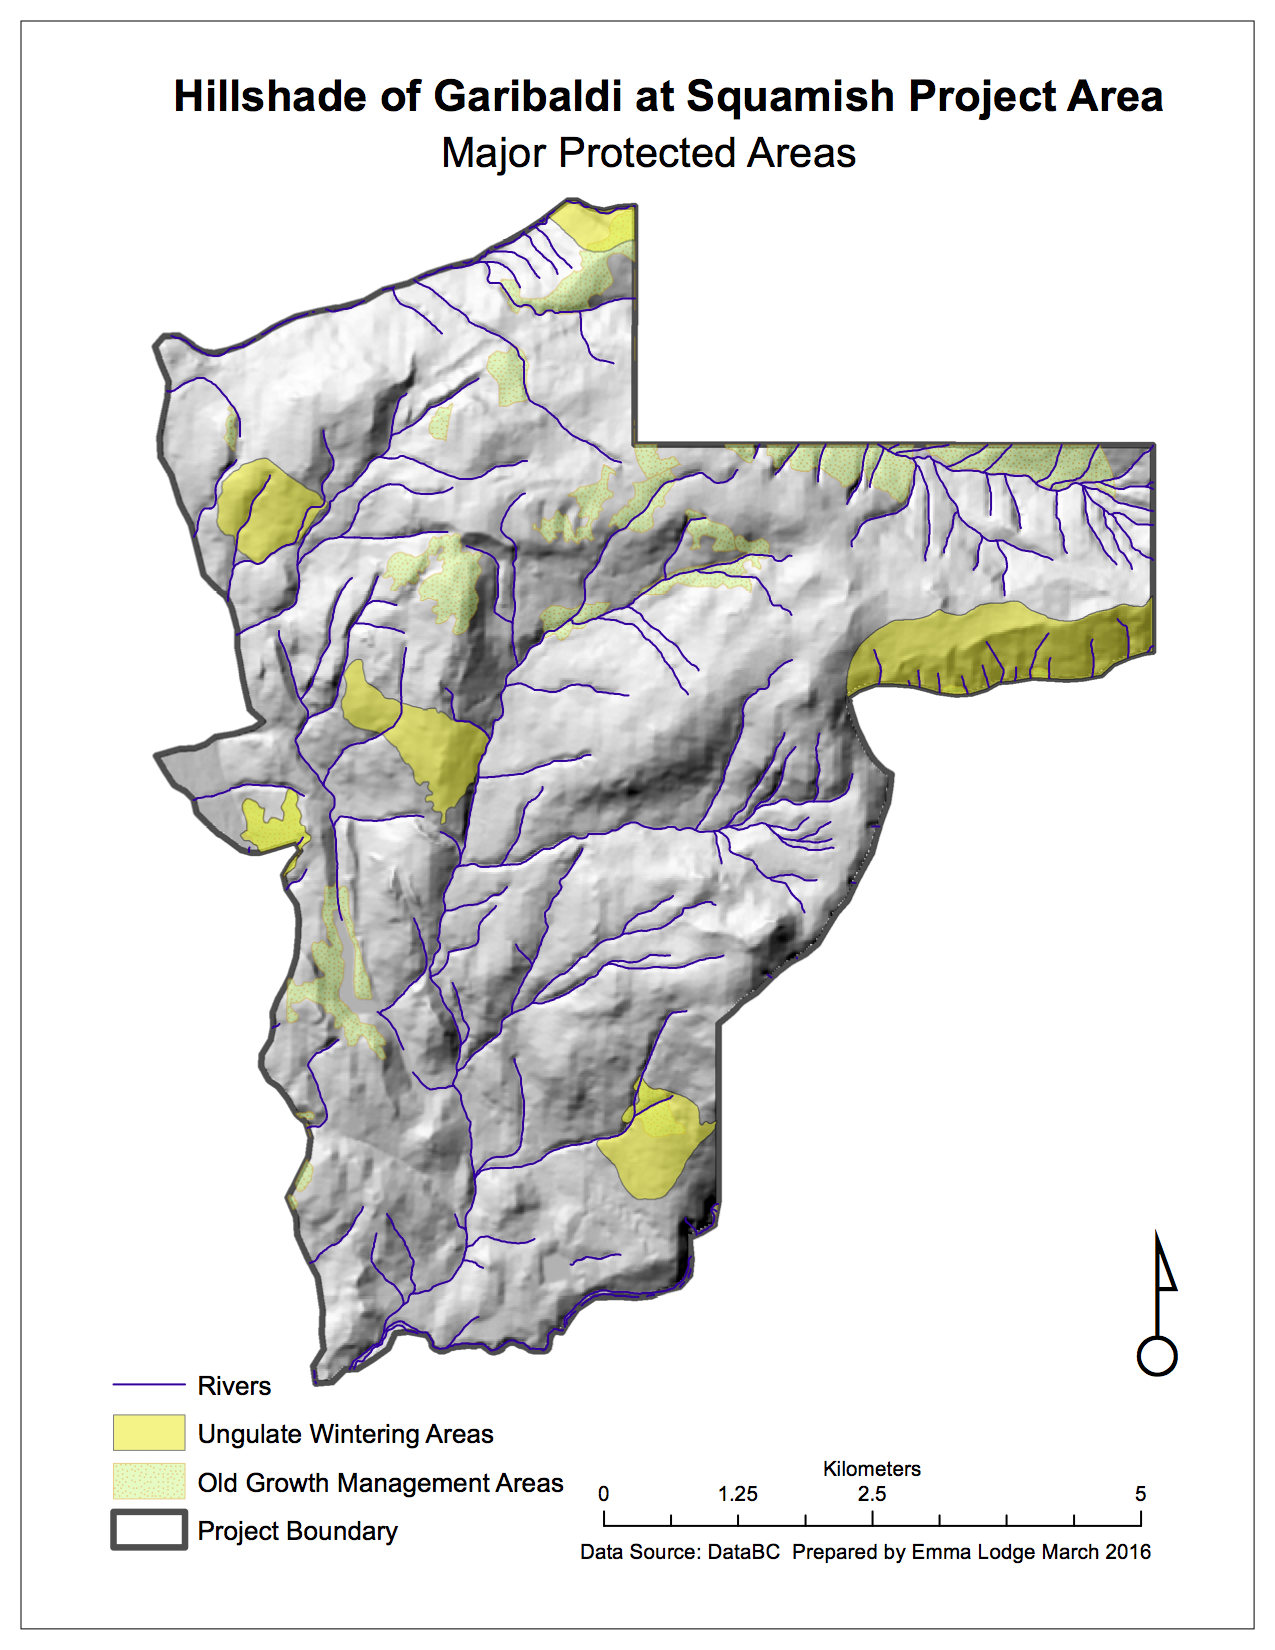
Old growth forest management areas

  • Steps: Collected data (DataBC), aggregated sums of all OGMAs within the proposed project boundary
  • Findings: 371 HA (7%) of the proposed project area are old growth management areas, and are undevelopable

Ungulate winter habitats

  • Steps: Collected data (DataBC), aggregated sums of all ungulate winter habitats within the proposed project boundary
  • Findings: 432 HA (8%) of the proposed project area are ungulate wintering areas and are undevelopable

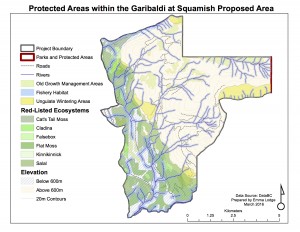
Red-listed ecosystems

  • Steps: Collected data, used Environmental Resource Management Ltd.’s listing of common red-listed ecosystems, searched our data set for areas that had the proper Biogeoclimatic unit and soil moisture content, identified the red-listed areas and aggregated sums of all red-listed ecosystems within the proposed project boundary
  • Findings: There are Falsebox, Salal, Cladina, Kinnikinnick, Flat Moss, Cat’s-Tail Mossecosystems within the proposed project area, and they comprise 1358 HA (25%) of the proposed project area

Fish Habitats

  • Steps: Collected river data, knowing that streams above 600m elevation are less likely to be fish-bearing, we created a 50 meter buffer on either side, for streams below 600m this buffer was increased to 100m on either side to protect fish-bearing streams, aggregated all protected habitat within the proposed boundary
  • Findings: 1438 HA (26%) of the proposed project area are within fish habitat and riparian areas and are undevelopable

After finding these individually protected areas, we used the software to combine all the areas that have at least one of these protected areas within them, or that are below 600m elevation to discover that 56 percent (2882 HA) of the proposed project falls within this area. Once the data was collected, cleaned up, and the values found, we used mapping software to create a map which highlights the areas that are off-limits to development. This map is included in our report, with the problematic areas highlighted. It should also be noted that a small section of the project falls within a protected park and is undevelopable.

Our analysis of the data and the creation of this map lead me to advise that the greatest environmental concerns for the proposed Garibaldi at Squamish project are to avoid the environmentally sensitive areas that are protected and that the resort and ski trails have limited impact on fish-bearing habitats. While these areas take up a large percentage of the project area, they mostly fall beneath the 600m contour line which is unadvisable to build on as this area does not receive adequate snowfall. Therefore, these issues could be mitigated by building above 600m elevation and by using previously build roads in order to limit the environmental impact of building new ones.

While there are hurdles to overcome, we believe that with adequate environmental protections and precautions the Garibaldi at Squamish resort has the potential to raise the profile of the Sea-to-Sky corridor and positively impact the region.

Sincerely,

Emma Lodge

Lead Planner

Big Sky Natural Resource Planning

protected areas-2

hillshadeclip

The above memo was created as part of a scenario in which I was assigned to be a proponent of the Garibaldi at Squamish resort development. In reality, I do not think that the resort development should proceed because the area that is being suggested falls within major old growth forest management areas, is surrounded by red listed ecosystems and directly impacts ungulate wintering areas. Therefore, the impact of the resort would outweigh the benefits of its construction.


Comparing Housing Affordability in Vancouver and Ottawa

Quantitative Data Classification

When choosing a method for quantitative data classification it is important to consider the ethics, visual display and purpose of the map. Different uses will require difference classification methods. For example, as a journalist, I would select the Manual Breaks classification; this allows readers to clearly see what the cost is in each part of the city and census tract. As well, I can make the intervals simple and intuitive so that my readers can easily grasp what the map is showing them. In a different example, as a real estate agent working near UBC, I would likely select the Equal Interval classification because you could point out that although areas near UBC are expensive; there are other areas that are more expensive so there would be more incentive to buy at UBC.

There are ethical implications to what classification method we use because it can easily sway the outcome of the map. It is easy to distort the map so that it looks as if everything in Vancouver is either very expensive or very inexpensive by setting very wide intervals. As well, when using Manual Breaks, I am selecting what the range that I want to have displayed which may be problematic as I could possibly be manipulating the data.

As you can see from the following map, it is important to recognize how much the different data classifications can impact the final product.

dataclass

Housing Affordability

This map visualizes housing affordability in Vancouver compared to Ottawa. Affordability is a a measure of  income compared to housing costs, this is a better measure than simply housing costs because it allows  us to compare two cities regardless of what the average income is for that city and instead focus only on what is actually a reasonable amount to spend on shelter costs. These maps are based on the 12th Annual Demographia International Housing Affordability Survey which rates affordability based on the “Median Multiple” which uses data from nine countries to evaluate housing markets and is used by the World Bank and the United Nations. This is a trusted and well used source that has done comparable work over many years and has created a standard which is easy to follow and understand.

While this map tells us about the affordability of Vancouver compared to Ottawa, it does not tell us about how liveable each city is, which is the quality of life in each city. Despite Vancouver’s unaffordability, it is ranked as one of the most ‘liveable’ cities in the world because of its stability, culture, lifestyle, climate, education and infrastructure.

affordability


Reflections on Labs 1-3

Here is a brief look at the skills and proficiencies I gained while working with ArcGis on the first labs of Geob 270

Lab 1 

Having no previous knowledge of Geographic Information Systems, I completed an introductory module to gain a knowledge of the functions and features of ArcGIS. This was valuable in providing me with a reserve of skills from which to draw from as I more forward in learnign mroe advanced GI skills.
Accomplishment Statement: Gained awareness of the features and functions of ArcGIS while completing the four hour ‘Getting Started with GIS’ introductory module learning how to query data and properly read GI created maps.

Lab 2

The key skill I learned in Lab two was how to fix and re project misaligned spatial data including how to ‘project on the fly’ and how to create a new data layer to effectively change the projection to the proper coordinate system
Accomplishment Statement: Evaluated data to determine if it was in the proper projection, and if not used the ‘project on the fly’ tool or created a new layer to retroject the data.

Lab 3

The most important skill I learned in Lab 3 was how to extract information from a dataset.

Accomplishment Statement: Queried datasets in order to extract information pertinent to creating a map of tsunami danger zones in Vancouver.

Tsunami Planning in Metro Vancouver

Although the city of Vancouver is protected from most tsunami danger by Vancouver island, there is still a risk of damage and danger in the city, particularly in low lying areas below 15 m above sea level and within one kilometre of the shore line. This map highlights where those danger areas are, what type of land use would be affected, and what type of road would be affected. I have also highlighted areas where signage could be placed to warn the public of this danger.

Tsunami Danger in Metro Vancouver

From this map and subsequent analysis, I concluded that 15 percent of the total area of Vancouver is in the danger zone. To find this, I used the statistics tool within ArcMap to find the total area of Vancouver and the total area of the danger zone (below 15 m and within one kilometre of the shoreline) and divided the two.

I also discovered that there are four health care facilities ( False Creek Residence, Villa Carthay Care Home, Yaletown House Society, Broadway Pentecostal Lodge) and eight schools (Henry Hudson Elementary, Emily Carr Institute, False Creek Elementary, Vancouver Montessori, St. Anthony of Padua, Heritage 3Rs, the Institute of Indigenous Government, Ecole Rose Des Vents) within the danger zone. This was discovered when I used the ‘Select by Attribute’ feature of ArcMap to look at the EDUCATION and HEALTHCARE features that were within the danger zone.