I am a second year student studying Political Science and Geography at the University of British Colombia. My time in GEOB270 has taught me how to use ArcMap in order to create visually appealing maps that allow me to share important information with the general public. I have also gained a deeper understanding of the theory and ethics behind Geographic Information Systems and feel more prepared to analyze the data and maps in the everyday world. In the Spring of 2016, I created an Environmental Impact Assessment for the Garibaldi at Squamish resort development, analyzed Landsat data and created a proposal for the City of Vancouver to improve its bike infrastructure.
Final Project Reflections
The purpose of our final project was to provide the City of Vancouver with a survey of the current state of bike lane infrastructure and to suggest improvements in order to improve bike lane infrastructure as the city moves towards its goal of Greenest City 2020. After acquiring data from a wide array of sources, we used ESRI’s ArcGIS program to create a series of visual representations of current infrastructure, income, bike usage, population, bike accidents and schools. After extracting key data, we performed visual analysis to determine that while current infrastructure serves those who already bike, improvements could be made to encourage more biking. We created six maps and included these in the appendices. As well, we chose to work together as a group to tackle this project, everyone contributed to the making of the maps as well as to the writeup.
This was an interesting project to work on together and I enjoyed working on a project that I could actually see being implemented in my city. I often travel along the bike lanes that we researched and so I was able to contribute practical knowledge to the creation of our maps and sources. Working on this project required a lot of communication and sharing of data and information. We found it best to each work individually while checking in with each other often, as this allowed us to use our own creativity in the project, which we could then share with others. We were lucky in that our data was easy to source and easy to access for everyone, I imagine that if you were using a more complicated dataset, it may be difficult to transfer the data among partners. Our data came mainly from the City of Vancouver database, which was a great help for us. We appreciated that the city is so open to citizen science and is willing to support it however possible. Finally, although I recognize that some of our suggestions are likely not feasible, such as dedicating one lane of Kingsway to bicycles, we have created a great database of information and data that can be drawn from in order to make decisions regarding the placement of further bike lanes.
Group Report on City of Vancouver Bike Lane Infrastructure
GreenBikers Consultancy Group Report on City of Vancouver Bike Lane Infrastructure
Group Members: Jessica Hak Hepburn, Emma Lodge, Spencer Schoen, Kianna Zivny
Abstract
The purpose of this report is to provide the City of Vancouver with a survey of the current state of bike lane infrastructure and to suggest improvements in order to improve bike lane infrastructure as the city moves towards its goal of Greenest City 2020. After acquiring data from a wide array of sources, we used ESRI’s ArcGIS program to create a series of visual representations of current infrastructure, income, bike usage, population, bike accidents and schools. After extracting key data, we performed visual analysis to determine that while current infrastructure serves those who already bike, improvements could be made to encourage more biking. The results of all these maps are included in the appendix. While some of the data for this project is lacking and outdated, we were able to conduct a detailed assessment of the City of Vancouver bike lanes in order to suggest improvements.
Description of project, study area, data
GreenBikers Consultancy Group was retained by the City of Vancouver to asses the state of the city’s bike lane infrastructure to determine the quality of access and where changes could be made to increase access or increase safety. This includes the assessment of number of bike lanes, bike lane accident analysis, and access to bike lanes. This is an important project for the City of Vancouver as they move towards their goal of becoming the greenest city in the world by 2020. Improvements to bike lane infrastructure will be vital to achieving this goal. Improvements to access and safety of bike lanes will increase ridership as people feel more safe and they are not disadvantaged by biking instead of driving.
We looked at data from the City of Vancouver database as well as independently sourced data to gather a complete picture of the scenario. Data dates range from 2008 to 2016. This is a large time period and we acknowledge that bike lanes may have already improved within Vancouver since 2012, but that information was not accessible. Gathering data directly from the City of Vancouver was important to our project because it allows us to work with the city to create maps and analysis that they will be able to work with directly. We looked at income, bike usage, school locations and population density because these are populations who are biking, or could increase bike use.
Our scope was limited to the City of Vancouver as we wanted to properly asses inner-city bike lanes, knowing that suburban and outlying communities rarely have the same infrastructure. Bike riding in Vancouver is already quite popular, and this may be different that outlying communities and we did not want our work to be influenced by outside data. Finally, Vancouver offers an interesting place to analyze as it our home and we are looking for solutions that will positively impact our own lives.
Methodology of Analysis
To begin analysis on how to improve the City of Vancouver’s bike lane infrastructure we focused on bike accidents, current bike lane type, school locations, individual income, bike usage, and population density. These datasets provided us with the ability to properly analyze our project area because they provided context to where and why accidents are happening in order to improve safety and whether current bike lanes connect to enough schools. They gave us a thorough understanding of any patterns that evolve comparing bike accidents to bike usage and population density, and access to bike lanes to those with low individual income.
We first acquired our desired data from the City of Vancouver databank, the Computing in the Humanities and Social Sciences Faculty of Arts & Sciences (CHASS) data center at the University of Toronto and a local hard-drive before creating a geo-database to track our data throughout the project. We used ESRI’s ArcGIS to complete this project as it allows us to perform in-depth analysis and the creation of visually appealing maps. After consolidating our data, we made sure to correct the projection to apply to Vancouver, which is in UTM Zone 10. Since our data included all of Metro Vancouver, we then clipped the area to include only the City of Vancouver proper to make the dataset more inclusive to our subject area
Dealing with the median income and population data required the use of tabular data and selecting out the data that was pertinent to Vancouver. We joined the population data and the income data to the Vancouver census tracts in order to visualize, by colour, the income or population per census tract. By presenting the data in the form of colour, it is easier to visually understand the map and acquire a basic understanding of what is being presented.
The next steps taken were implemented on individual maps. To be able to see if bike lanes were in close proximity to schools (as determined by a 100m, city block, buffer), we created a buffer to highlight whether a new bike lane needed to be created in this area, or if an existing bike lane would suffice. We were able to then visualize this data as well as perform an intersect to see the same information in tabular form.
After finishing the first wave of maps, we were able to simultaneously compare our visual data and use this knowledge to determine where new proposed bike lanes should be constructed. We then created a new map consisting of already established bike lanes, mixed with our proposed bike lanes based on the maps we created before. Having completed in- depth analysis on the individual maps, we were able to use that data to create a final map to highlight key areas where bike infrastructure could be improved to work towards Vancouver’s goals.
Discussion and Results
Our analysis of the City of Vancouver’s bike infrastructure began with the creation of separate maps in order to visually understand the current system and how it could be improved. What follows is a look at each of the segments and maps created followed by a description and explanation of what improvements we suggest to be made.
Bike Lanes and Schools
In order to determine the accessibility and safety of current bike infrastructure in relation to schools, we have created a map to visualize the placement of bike lanes in relation to schools (Map 5). We believe that access to bike lanes in close relation to schools is vitally important to improving the feasibility of green infrastructure in the future because it is important to start offering alternative transport methods from a young age. As well, recent studies demonstrate the importance and value of physical education prior to starting the school day (Alphonso, 2016). However, it is also important to consider this is a vulnerable population and bike lanes must be created that allow for safe transport in order to encourage use.
To determine the current level of bike infrastructure, we mapped the schools with a 100m boundary around each one to determine access to bike lanes. A buffer of 100 meters was chosen as this is the average length of a city block, therefore visual sight lines would be protected in order to increase safety. When this buffer and current bike lanes were mapped, we discovered that only 53 of 113 schools are within what we deem to be a reasonable access distance meaning that more than 50 percent of schools do not have adequate bike lane access, something that must be remedied to create a better bike atmosphere in the City of Vancouver.
Bike Lanes and Median Income
To determine improvements to be made in order to increase access to those with low incomes, we created a map which visualizes bike lanes and median income per census tract (Map 2). From this map we can understand the distribution of wealth in the City of Vancouver. This is important because we recognize that those with low incomes may not be able to access cars and as a complement to public transportation, improvements to bike infrastructure will increase mobility for these residents.
We visualized this information by colour in order to easily identify areas that require further improvements and found that the key area to improve is the South-East, and have thus suggested the creation of multiple bike lanes to serve this area. These improvements are vital to make because they will benefit the less fortunate by allowing alternative forms of transportation and benefit the city on the whole by increasing bike ridership over other less environmentally friendly forms of transportation.
Bike Lanes and Bike Accidents
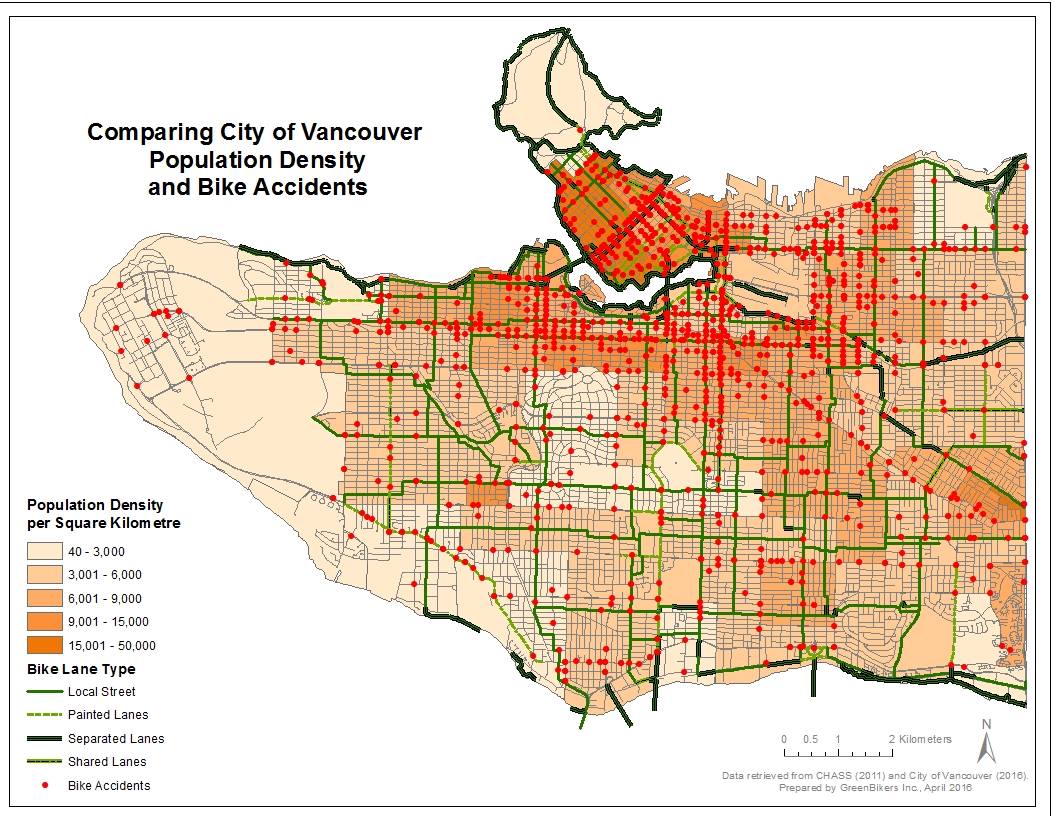
In order to determine where to make recommendations for new bike lane infrastructure, we have created a map depicting the locations of bike accidents within the City of Vancouver (Map 1). With the information presented where bike accidents are occurring in relation to the current bike infrastructure available for bike users, we can locate troubled areas within the city that are in need of improvement. Data downloaded from the City of Vancouver database shows the point locations of accidents that occurred in Vancouver between 2008 and 2012. We found that the total number of bike accidents that occurred between 2008 and 2012 was 1,750. The accident location data is overlaid on the current bike lane infrastructure data from the City of Vancouver (March 2016).
There are currently four different types of bike lanes in place in Vancouver. These include local street lanes, painted lanes, separated lanes and shared lanes. Based on the amount of accidents in certain areas, we can determine which type of bike lane is the safest and which lanes are potentially unsafe compared to the others. With this data, we can also determine which areas and, specifically, which streets in Vancouver need bike lanes based on the number of accidents that congregate in each location without bike lanes in place.
Based on this map, we can make recommendations to improve bike lane infrastructure in a number of areas within the City of Vancouver. We have determined that separated bike lanes are the safest based on the low number of accidents and the fact that bikers are separated from vehicle traffic. From this map we can also see that many of the bike lanes currently in existence are incomplete and we recommend that the city improve this. It is apparent that the downtown core, as well as the Kitsilano and Mt Pleasant neighbourhoods, are high accident areas.
Bike Lanes, Bike Usage and Population Density
To get a better idea of who is currently biking in Metro Vancouver, we created a map of bike usage according to neighbourhoods (Map 4). The only relevant data available covered individuals 15 years and older who used a bike as their mode of transportation to work. Understanding that this does not cover other major sources of bike usage, it is still a good representation because these individuals most likely bike on a regular basis. Out of a population of 642,859 residents, 13,035 individuals bike to work, so roughly 2%, being one of the highest bike users in Canada, according to Teschke et al. (2012). The heaviest bike usage is seen within, in descending order, Mount Pleasant, Fairview, Kitsilano, South Cambie, Grandview-Woodland, and Riley Park neighbourhoods. These neighbourhoods makeup about 6% of all bike users in the city.
This map also includes locations of bike accidents to observe any patterns that arise between bike usage and accidents. The highest amount of accidents do not necessarily correspond to bike use. While a high amount of accidents do correlate to high use areas in South Cambie, Fairview, and Riley Park, a large amount of bike accidents occur in the West End and Downtown, neighbourhoods on the lower end of bike usage.
We also looked at population density and how that relates to bike accidents (Map 3). Downtown and the West End have the highest density, totalling about 28% of the city population, but some of the lowest bike usage. While low bike usage probably correlates to people walking to work, there is still a high number of bike accidents. This could mean that the few people who are biking to work have a higher chance of getting hurt, and improvements could be made to either existing bike lanes or addition of new ones.
Recommended Upgrades
Following the analysis of our maps, we can conclude that while the City of Vancouver currently has a strong bike infrastructure system, further improvements should be made. We have created a final map which highlights the bike lanes that we suggest to be added to the current network (Map 6). There are currently 290 kilometers of bike lanes in the City of Vancouver, and we propose to add a further 63 kilometers to that network, 15 kilometers of local street lanes, 19 kilometers of painted lanes and 29 kilometres of separated lanes. While some of these lanes are brand new to serve different areas, some were added to complete the network and limit areas in which a rider would have to leave the bike lanes.
We suggest the addition of multiple lanes in the downtown core, as this is where the majority of bike accidents occur and more bike lanes should increase safety. We recommend adding separated lanes along Georgia and Denman streets downtown and a painted lane along Granville street. We also suggest the addition of additional lanes in the Mount Pleasant, Fairview, Kitsilano, South Cambie, Grandview-Woodland, and Riley Park neighbourhoods as this is where bike ridership is at its highest and additional lanes will help to reduce bike congestion which may lead to collisions. Many of these areas have local street lanes, but we recommend that a separated lane would be better suited to deter the number of accidents occurring.
In order to increase bike ridership among those with lower incomes, we added separated bike lanes along Kingsway and 49th Avenues which access the areas of lowest median income in the city. These safe bike lanes will increase potential riders who may not have access to cars or public transport, creating a more equal access to areas.
Finally, many of the bike lane additions will enter into the buffer zones of schools, increasing access for young children and improving safety in a move to increase ridership. The addition of these bike lanes will improve bike infrastructure in the City of Vancouver and help Vancouver move towards its goal of Greenest City 2020 by increasing bike ridership and decreasing reliance on automotive transportation.
Error and Uncertainty
Our analysis of the City of Vancouver bike lanes and possible infrastructure upgrades is not without flaws. Most pressing is the availability of data regarding bike lane accidents. The data regarding bike accidents in this report was from 2008 – 2012 as current data from the City of Vancouver was not available. We used the most up to date data available to us at the time but given it is not from 2016, these numbers will have changed over the past four years and our analysis has the potential for error. The most recent census data available is from 2011 and this too has room for potential error and uncertainty. Although the data for the current bike infrastructure is from 2016, we do not know which bike lanes have already been fixed or are in the process of being renovated. We understand that the City of Vancouver could potentially already have areas that they want to improve the bike lane infrastructure in that differs from our recommendations that we based off of our individual analyses.
Regarding our recommendations to improve bike lane infrastructure, we understand that more in-depth and site-specific analysis would be needed to determine the location and type of new bike lanes to be put in place. Data such as road type and use, traffic patterns, road space available, the city’s budget for improving bike infrastructure etc. was beyond the scope of our report and we instead focused on analyzing the data that was available to us to make our recommendations. Our recommendations may or may not be realistically feasible, for example we do not know if we are able to remove a lane of traffic and replace it with a separated bike lane or budget wise if it is realistic, but we are instead focusing on areas of concern within our dataset.
It is important to outline a few other areas that have the potential to include error or uncertainty such as our basis of determining which lanes are safe or unsafe. There is always room for uncertainties when you find a correlation between two variables, such as the lanes that are used the most have the most collisions occurring on them (is this because they are unsafe or because they are high bike traffic areas?). UBC data was also unavailable regarding the bike infrastructure and census data. We would also like to point out this was the first time doing a project completely on our own. Opportunity for error due to various minor details such as tool selection or data joining etc. is present. We realise that the bike lanes go outside of our project boundaries in some instances but clipping the existing bike lanes to the Vancouver mask cut out a portion of the lanes we needed to analyze. This resulted in keeping the layer unclipped to preserve the information we needed.
Further Research and Recommendations
Further research is needed to retrieve data that includes those individuals who bike for activities other than for work, such as biking for recreation or biking to school. Our study only focused on the City of Vancouver, so a detailed assessment of Metro Vancouver could be useful to better understand how suburban bike routes and accidents relate and compare to that of City of Vancouver, primarily North Vancouver and Burnaby. However, we recommend to first improve bike infrastructure in the City of Vancouver to bring down bike accidents and improve ridership. Doing yearly data collection of accidents and bike usage to document whether upgrades were successful will allow the CIty of Vancouver to be a template for other areas in Metro Vancouver.
Teschke et al. (2012) state that previous studies have been against bike-specific infrastructure in Canada resulting a dominant influence on the bike infrastructure seen today. However, when looking at certain European cities such as Netherlands and Denmark, they have cycle specific tracks alongside major city streets and as previously mentioned, they have much higher bike usage. These separated cycle tracks are also the safest and preferred by cyclists (Teschke et al., 2012). Currently in the City of Vancouver, separated bike lanes are in areas that mainly encourage recreational cycling (along seawalls) but are not in place to encourage daily transportation. We encourage the City of Vancouver to implement and upgrade the majority of bike lanes as separated bike lanes and to again do yearly data collection to document whether or not it is in fact the safest way to cycle.
Appendices
i.Bibliography
Alphonso, C. (2016, April 5). Fewer Canadian students walking or cycling to school raises
concerns. The Globe and Mail. Retrieved from http://www.theglobeandmail.com/
City of Vancouver (2016). Open Data. Retrieved from http://vancouver.ca/your-
government/open-data-catalogue.aspx
Computing in the Humanities and Social Sciences Faculty of Arts & Science, University of
Toronto (2011). Canadian Census Analyzer. Retrieved from
http://datacentre.chass.utoronto.ca/census/
Teschke, K.,Harris, M. A., Reynolds, C. C. O., Winters, M., Babul, S.,Chipman, M., Cripton, P.
A. (2012). Route infrastructure and the risk of injuries to bicyclists: A case-crossover
study. American Journal of Public Health, 102(12), 2336-2343.
ii. Maps and Figures


Garibaldi at Squamish Environmental Impact Assesment
Memo
To: Northland Properities and the Aquilini Group
From: Emma Lodge of Big Sky Natural Resource Planning
Date: 2016-03-16
Subject: Garibaldi at Squamish project priorities and planning
The proposed Garibaldi at Squamish year-round resort, which will sit on Brohm Ridge (fifteen kilometers north of Squamish), has the opportunity to become a world-class recreation and commercial facility but attention must be paid in order to preserve the exquisite natural surroundings. While the project was recently approved, forty conditions were put in place to prevent or reduce any significant environmental, social, economic heritage and health effects. As lead Natural resource planner at the retained Big Sky Natural Resource Planning, I write to you today with my recommendations on most critical of these conditions in order to proceed in a way that is viable for your commercial development and the continued care of the natural environment.
In order to analyze the project and criticisms, we used advanced computer software to analyze the geographic and spatial data (ArcGIS). After collecting all the requisite data, we limited the data and maps to only the proposed area of 5472 HA. This then allowed us to use the software and our knowledge of the project to search the data for areas that would directly impact old growth forest management areas, ungulate winter habitats, red-listed ecosystems and fish habitats. See below for the steps taken and results.
Impacted Areas and Ecosystems
Old growth forest management areas
- Steps: Collected data (DataBC), aggregated sums of all OGMAs within the proposed project boundary
- Findings: 371 HA (7%) of the proposed project area are old growth management areas, and are undevelopable
Ungulate winter habitats
- Steps: Collected data (DataBC), aggregated sums of all ungulate winter habitats within the proposed project boundary
- Findings: 432 HA (8%) of the proposed project area are ungulate wintering areas and are undevelopable
Red-listed ecosystems
- Steps: Collected data, used Environmental Resource Management Ltd.’s listing of common red-listed ecosystems, searched our data set for areas that had the proper Biogeoclimatic unit and soil moisture content, identified the red-listed areas and aggregated sums of all red-listed ecosystems within the proposed project boundary
- Findings: There are Falsebox, Salal, Cladina, Kinnikinnick, Flat Moss, Cat’s-Tail Mossecosystems within the proposed project area, and they comprise 1358 HA (25%) of the proposed project area
Fish Habitats
- Steps: Collected river data, knowing that streams above 600m elevation are less likely to be fish-bearing, we created a 50 meter buffer on either side, for streams below 600m this buffer was increased to 100m on either side to protect fish-bearing streams, aggregated all protected habitat within the proposed boundary
- Findings: 1438 HA (26%) of the proposed project area are within fish habitat and riparian areas and are undevelopable
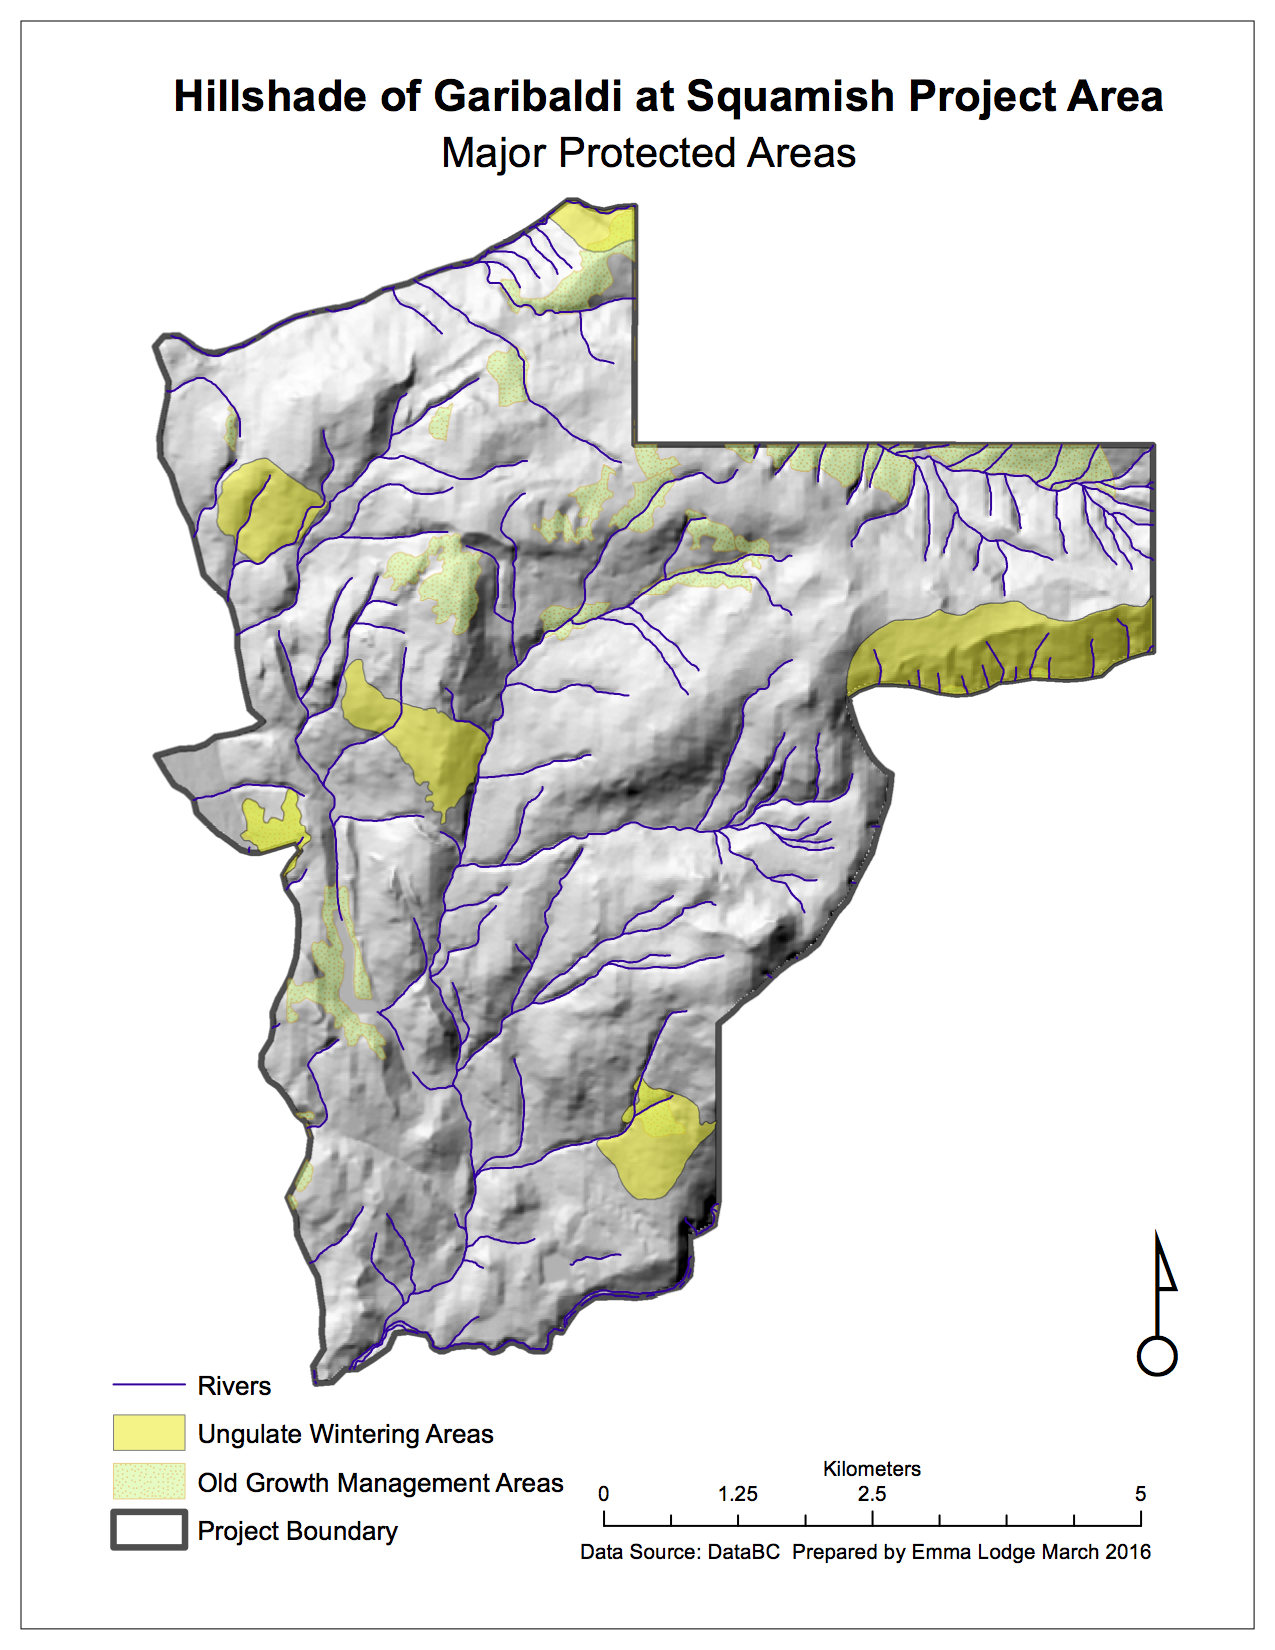
After finding these individually protected areas, we used the software to combine all the areas that have at least one of these protected areas within them, or that are below 600m elevation to discover that 56 percent (2882 HA) of the proposed project falls within this area. Once the data was collected, cleaned up, and the values found, we used mapping software to create a map which highlights the areas that are off-limits to development. This map is included in our report, with the problematic areas highlighted. It should also be noted that a small section of the project falls within a protected park and is undevelopable.
Our analysis of the data and the creation of this map lead me to advise that the greatest environmental concerns for the proposed Garibaldi at Squamish project are to avoid the environmentally sensitive areas that are protected and that the resort and ski trails have limited impact on fish-bearing habitats. While these areas take up a large percentage of the project area, they mostly fall beneath the 600m contour line which is unadvisable to build on as this area does not receive adequate snowfall. Therefore, these issues could be mitigated by building above 600m elevation and by using previously build roads in order to limit the environmental impact of building new ones.
While there are hurdles to overcome, we believe that with adequate environmental protections and precautions the Garibaldi at Squamish resort has the potential to raise the profile of the Sea-to-Sky corridor and positively impact the region.
Sincerely,
Emma Lodge
Lead Planner
Big Sky Natural Resource Planning

The above memo was created as part of a scenario in which I was assigned to be a proponent of the Garibaldi at Squamish resort development. In reality, I do not think that the resort development should proceed because the area that is being suggested falls within major old growth forest management areas, is surrounded by red listed ecosystems and directly impacts ungulate wintering areas. Therefore, the impact of the resort would outweigh the benefits of its construction.
Comparing Housing Affordability in Vancouver and Ottawa
Quantitative Data Classification
When choosing a method for quantitative data classification it is important to consider the ethics, visual display and purpose of the map. Different uses will require difference classification methods. For example, as a journalist, I would select the Manual Breaks classification; this allows readers to clearly see what the cost is in each part of the city and census tract. As well, I can make the intervals simple and intuitive so that my readers can easily grasp what the map is showing them. In a different example, as a real estate agent working near UBC, I would likely select the Equal Interval classification because you could point out that although areas near UBC are expensive; there are other areas that are more expensive so there would be more incentive to buy at UBC.
There are ethical implications to what classification method we use because it can easily sway the outcome of the map. It is easy to distort the map so that it looks as if everything in Vancouver is either very expensive or very inexpensive by setting very wide intervals. As well, when using Manual Breaks, I am selecting what the range that I want to have displayed which may be problematic as I could possibly be manipulating the data.
As you can see from the following map, it is important to recognize how much the different data classifications can impact the final product.

Housing Affordability
This map visualizes housing affordability in Vancouver compared to Ottawa. Affordability is a a measure of income compared to housing costs, this is a better measure than simply housing costs because it allows us to compare two cities regardless of what the average income is for that city and instead focus only on what is actually a reasonable amount to spend on shelter costs. These maps are based on the 12th Annual Demographia International Housing Affordability Survey which rates affordability based on the “Median Multiple” which uses data from nine countries to evaluate housing markets and is used by the World Bank and the United Nations. This is a trusted and well used source that has done comparable work over many years and has created a standard which is easy to follow and understand.
While this map tells us about the affordability of Vancouver compared to Ottawa, it does not tell us about how liveable each city is, which is the quality of life in each city. Despite Vancouver’s unaffordability, it is ranked as one of the most ‘liveable’ cities in the world because of its stability, culture, lifestyle, climate, education and infrastructure.

Reflections on Labs 1-3
Here is a brief look at the skills and proficiencies I gained while working with ArcGis on the first labs of Geob 270
Lab 1
Having no previous knowledge of Geographic Information Systems, I completed an introductory module to gain a knowledge of the functions and features of ArcGIS. This was valuable in providing me with a reserve of skills from which to draw from as I more forward in learnign mroe advanced GI skills.
Accomplishment Statement: Gained awareness of the features and functions of ArcGIS while completing the four hour ‘Getting Started with GIS’ introductory module learning how to query data and properly read GI created maps.
Lab 2
The key skill I learned in Lab two was how to fix and re project misaligned spatial data including how to ‘project on the fly’ and how to create a new data layer to effectively change the projection to the proper coordinate system
Accomplishment Statement: Evaluated data to determine if it was in the proper projection, and if not used the ‘project on the fly’ tool or created a new layer to retroject the data.
Lab 3
The most important skill I learned in Lab 3 was how to extract information from a dataset.
Accomplishment Statement: Queried datasets in order to extract information pertinent to creating a map of tsunami danger zones in Vancouver.
Tsunami Planning in Metro Vancouver
Although the city of Vancouver is protected from most tsunami danger by Vancouver island, there is still a risk of damage and danger in the city, particularly in low lying areas below 15 m above sea level and within one kilometre of the shore line. This map highlights where those danger areas are, what type of land use would be affected, and what type of road would be affected. I have also highlighted areas where signage could be placed to warn the public of this danger.

From this map and subsequent analysis, I concluded that 15 percent of the total area of Vancouver is in the danger zone. To find this, I used the statistics tool within ArcMap to find the total area of Vancouver and the total area of the danger zone (below 15 m and within one kilometre of the shoreline) and divided the two.
I also discovered that there are four health care facilities ( False Creek Residence, Villa Carthay Care Home, Yaletown House Society, Broadway Pentecostal Lodge) and eight schools (Henry Hudson Elementary, Emily Carr Institute, False Creek Elementary, Vancouver Montessori, St. Anthony of Padua, Heritage 3Rs, the Institute of Indigenous Government, Ecole Rose Des Vents) within the danger zone. This was discovered when I used the ‘Select by Attribute’ feature of ArcMap to look at the EDUCATION and HEALTHCARE features that were within the danger zone.
Fixing up Spatial Data and Landsat Image Use
Fixing Misaligned Data
Often when we download or receive data, it doesn’t match or line up with the data that we already have. One common problem is when the coordinate systems are misaligned and improperly referenced, this can lead to distorted distances, areas, shapes or angles.
Depending on the project, we can fix this in one of two ways, either ‘projecting on the fly’, or by using commands that actually changes the coordinates. ‘Projecting on the fly’ is used when we are simply trying to make the map more visually appealing, there is no actual change to the coordinates. In contrast, using the commands in ArcToolbox allows us to change the coordinates so that in depth analysis can be performed.
Landsat Imaging
Landsat, a type of remote sensing, is used to gather information about an object or surface from a distance. Landsat remote sensing uses solar energy powered satellites that scan the earth’s surface to measure changes and responses to the surface, current technologies allow for a new picture every sixteen days.
This is useful to geographic analysis because we can compare before and after photos to see how the landscape changes. A great example of this is using Landsat imagery to compare before and after photos of the Mt. St. Helens eruption, we can clearly see how the landscape changed from 1979 to today.