Measurement
In order to comment on the state of biodiversity, the methods of measurement of biodiversity must be outlined.
It is difficult to quantify biodiversity, or even the rate of biodiversity loss for several reasons. To start with, as per the definition, biodiversity ranges from genetic differences between species up to global scales. For example, it can be said that there are four defined levels of biodiversity in ecology[1].
Measures of local or alpha biodiversity can be calculated via several different indices. This could include species richness, the total number of organisms present, or other indices such as the Simpson Index, Shannon-Weiner index, or the Evenness index, which include not only the number of species present but also factors such as how similar the abundance of each species, in order to account for communities with very large numbers of organisms of few species not being very diverse.
Although species richness can be estimated on a global scale, it fails to give the whole picture as it ignores beta diversity and so doesn’t accurately represent effects such as biotic homogenization (see 3.2).
A further complication is that the very large, unknown number of species on the planet is difficult to estimate, and it is challenging to determine with certainty that a species is globally extinct. Nonetheless, for certain groups of species with more complete data, estimations can be made. For example, species extinctions in mammals and birds now happen at a rate of about 1 per year, which is quite extreme compared to a natural ‘background rate’ of the expected natural extinctions (derived from fossil record data) of 1 extinction per 200 years (Cain, Bowman, & Hacker, 2014, pp. 524-525). Nonetheless, including only extinctions as indicators of biodiversity loss is flawed because it omits smaller-scale biodiversity losses (i.e. if a species is only extirpated).
Several scientific studies have tried to estimate global biodiversity. For example, the PREDICTS database is a meta-analysis of studies with data pertaining to local-scale biodiversity across the planet and how it is effected by anthropogenic pressures (Hudson & Newbold, 2014). Another example of an attempt to estimate global terrestrial biodiversity uses extrapolation of data from local richness and measures of complementarity[2] (Colwell & Coddington, 1994).
Worldwide trends
Biodiversity loss has already exceeded its planetary boundary[3] (Rockstrom, et al., 2009)
By pressure
Human activities, especially conversion and degradation of habitats, are causing global terrestrial biodiversity declines (Newbold, et al., 2015). The effects of the pressures on biodiversity (see 2.1-2.5) and their effects in the past century along with their current trend are outlined in the following table:
Table 1: Historical and current trends in impacts on biodiversity by pressure in selected terrestrial biomes (After Millennium Ecosystem Assessment, 2005)
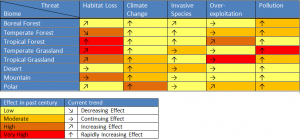
From Table 1, it is clear that in the past, habitat loss has had the most high or very high effects biodiversity in terrestrial biomes. Those effects are generally expected to stay relatively constant. Contrastingly, climate change has primarily had low effects in the past but those effects are expected to rapidly increase in all terrestrial biomes.
Species loss
The earth is losing species at an accelerating rate (Cain, Bowman, & Hacker, 2014, p. 524). According to the WWF’s Living planet report in 2014, there has been a sharp decline in biodiversity, marked by a 39% decrease in terrestrial species between 1970 and 2010 (WWF, 2014).
Figures from Newbold et al. 2012 show a steep loss in biodiversity (by the species richness index) starting in the mid-1800s. Predictions take into account different changes in land use, climate and human population sizes, and show either a continued loss or a lessened net richness change; however, no predictions show biodiversity returning near pre-1800s levels. A map from Newbold et al. 2012 demonstrates that, similarly to how biodiversity is not constant around the world, local biodiversity loss varies by location, dependent upon driving factors and pressures.
Biotic homogenization
Biotic homogenization is when groups of species become dominated by a small number of pervasive species and is an example of a loss in biodiversity ignored when considering only species richness. It is the result of humans having diverse impacts on species: some positive leading to the expansion of certain species, some negative leading to the decline of certain species. (Millennium Ecosystem Assessment, 2005).
[1] This includes alpha diversity, or diversity at a community scale; beta diversity, the difference in species between communities; gamma diversity, species diversity at a regional scale; and finally, global biodiversity (Cain, Bowman, & Hacker, 2014, p. 406)
[2] Related to beta diversity
[3] Planetary boundaries are thresholds which, if surpassed, result in unacceptable environmental change impacts on humans (Rockstrom, et al., 2009)
*The sharp decline in biodiversity including biotic homogenization and loss of species richness leads to many negative impacts on humans and the environment*