I developed an interest for GIS in this introductory class. At first, I was frustrated with the program: I didn’t know how to work it, it was time-consuming, and my maps didn’t look good. My interest for GIS grew when I found out that I could use it as a platform to study and visualize the topics that I am most interested in, like the environment. I also discovered that I work best in groups. Creating a final group project was fun!
Category Archives: Courses
Final Project: Mountain Pine Beetle Spread
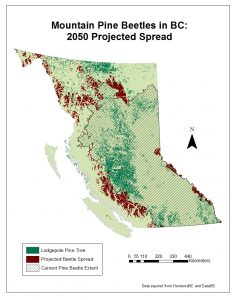
Predicting the Spread of Mountain Pine Beetles in British Columbia
In this final project, I worked with three other students to study the spread of the mountain pine beetle in British Columbia. It was a lengthy process, but it allowed me to put my GIS skills to the test. We conducted this project entirely independently, including acquiring data, manipulating and analyzing that data, producing a map, and discussing the results of of analysis.
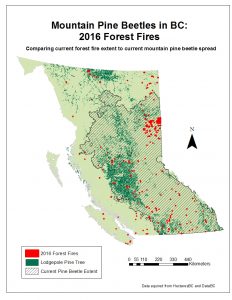
Our project aimed to map the future spread of the mountain pine beetle. It is a native species to British Columbia, but its intensive infestation has been cause of many problems since the 90s. We looked at the year 2050, and mapped where the beetle could spread to based on elevation, climate and the existence of the lodgepole pine tree: their preferred host. In addition, to show the importance of our analysis, we also mapped the current year forest fire area along with the current beetle infestation. We found a correlation between beetle infestation and area of forest fires.
We originally did not make a plan to organize the work. However, eventually we all took on our individual roles. Surprising, this worked quite well and we all ended up doing the same amount of work.
Findings
- Our findings confirmed predictions found on Natural Resources Canada that the beetle will soon be able to spread north into regions of BC that we previously uninhabitable to the species.
- There is a higher percent of forest fire area in infested areas than in un-infested areas.
- Some areas that we identified as possible spread-areas for the beetle may not have the opportunity due to lack of lodgepole pine
- Improved forest management policies must be put in place in order to protect the biodiversity of the lodgepole forests, in addition to protecting human processes.
- The ability of mountain pine beetle to spread by upper air winds makes it possible for the beetle to spread such large distances.
GIS Analysis- Lab 2
How to fix improperly referenced spatial data
When analyzing spatial data, it is important that all data is aligned and properly projected. Often, it will look like the data is in the proper projection, however ArgGis uses “project on the fly” in order to align datasets to look visually appealing. The first step is to check the projections, datum, and units of each layer under “properties”. Then, decide which projection is best for the analysis that you are performing. Projections can preserve, shape, area, distance, or angle.
To change the projection of a file that is in you table of contents, we use a tool in our toolbox. Go to Data Management > Projections and Transformations > Project. Choose your layer as the input and choose your desired projection as the output. A new layer will be added to the map.
Remotely Sensed Landsat Data
Landsat is a remote sensing system that produces imagery of the earth every 16 days. It allows us to analyze and compare data consistently throughout time. We can view images of a large area of land before and after a natural disaster, allowing us to compare, analyze and make decisions based on the damage that has been done.
Environmental Assessment: Garibaldi Ski Resort
Assessment
The proposed ski resort is to be set on the edge of Garibaldi Provincial park, about 80km north of Vancouver, situated in between Squamish and Whistler. The ski resort would be a massive undertaking, including up to 124 ski trails and 20 lifts, taking a total of 20 years to complete. One major setback to the project, and the economic success that it would provide, is the environmental detriment that it would cause.
As a natural resource planner, it is my job to assess the concerns of the environmental impacts of the projects and give a recommendation to the project proponents on how to proceed. The following are the questions that must be answered prior to the project’s initiation:
- How will the project affect the vegetation in the area? The fish? Wildlife?
- How do the projected environmental effects compare to the economic, social, and health effects of the project?
- To what extent will the elevation of the area effect the amount of reliable skiing that will be available in the project boundaries?
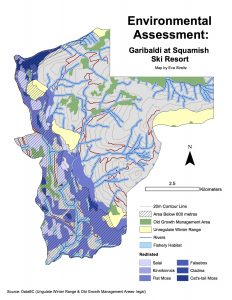
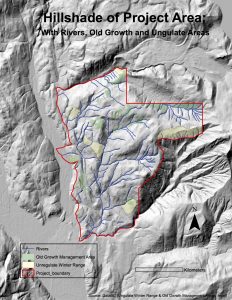
To assess the prior questions, I made a map and preformed a number of quantitative analysis’ to display the extent to which the proposed project boundaries contain environmentally sensitive areas. Taken in to account are: old growth management areas, Mule Deer and Mountain Goat habitat (ungulate winter range), endangered or threatened ecosystems (red-listed), fish habitats, and elevation below 600 meters.
In total, I found about 53% of the proposed project area to interfere with one or more of the prior environmental concerns. My biggest concern is the threat of the project to fish habitats (26%) and threatened species such as the Flat Moss, Falsebox, and Salal (25%). Interference with Mule Deer and Mountain Goat habitat is minimal, as is the threat to old growth management areas. However, I would consider closely the impact of elevation on the amount of profitable skiing. My analysis shows that close to 50% of the proposed project would not allow for consistent ski conditions.
In summary, I would advise against the development of a ski resort in Garibaldi-Squamish area. Other than reducing the size of the project, there are few ways to mitigate the damage. The effects to the environment are large enough to de-legitimize the economic and social incentive.
Comments on my recommendation
This assessment was difficult to perform, being that I personally feel strongly against the project. The environmental cost is too huge to justify the economic gains. As a skier myself, I don’t think the public has much to gain from the project, aside from saving the 30 minute drive north to reach Whistler Blackcomb Ski Resort. The implementation of this project will hurt other recreational activities such as backcountry mountaineering. This land should be preserved and kept away from profit-driven tycoons.
To a certain degree my personal beliefs affected my professional opinion. However, I truly believe that if they are to take the environmental implications seriously, they must greatly reduce the size of their project or move it to a different location.
Accomplishment Statements
- Learned to independently acquire data from public internet domains to use in my map
- Practiced parsing and filtering data to analyze
- Used written skills to effectively communicate the results of a GIS analysis
Housing Cost and Affordability
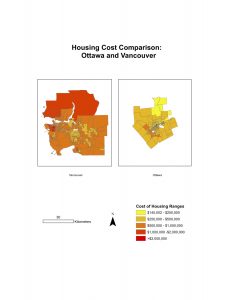
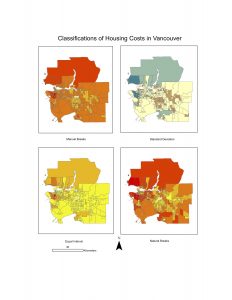
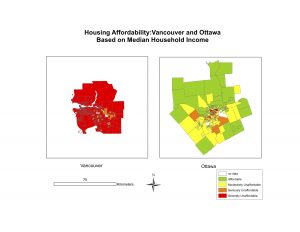
Notes regarding this project:
- Affordability measurement shows the affordability of a city based on the “median multiple”. This is a number, usually from 2-5, that indicates how many times more expensive the median house price is than the median household income. This measurement is better for comparing cities because the affordability of the city will be relative to the amount of money that people make in that city. A house that may be considered unaffordable in one city may be affordable in another city because the median household income is higher.
- The housing affordability ratings, determined by the Demographia International Housing Affordability Survey, are “Affordable” (3.0 & under), “Moderately Unaffordable” (3.1-4.0), “Seriously Unaffordable” (4.1-5.0) and Severely Unaffordable (5.1 & over).
- In conclusion, affordability is not a good indicator of a city’s livability. A city’s livability is largely determined by factors that are independent of a person’s wealth. Livability has more relation to the city’s layout, including parks, greenery, bike paths, accessibility, and mobility. Vancouver is an extremely livable city but not an affordable city.
Accomplishment Statements
- Practiced using the Canadian Census Data
- Learned different ways to display the same data: natural breaks, equal interval, standard deviation, manual breaks
- Practiced producing an effective map
City of Vancouver: Risk of Tsunami
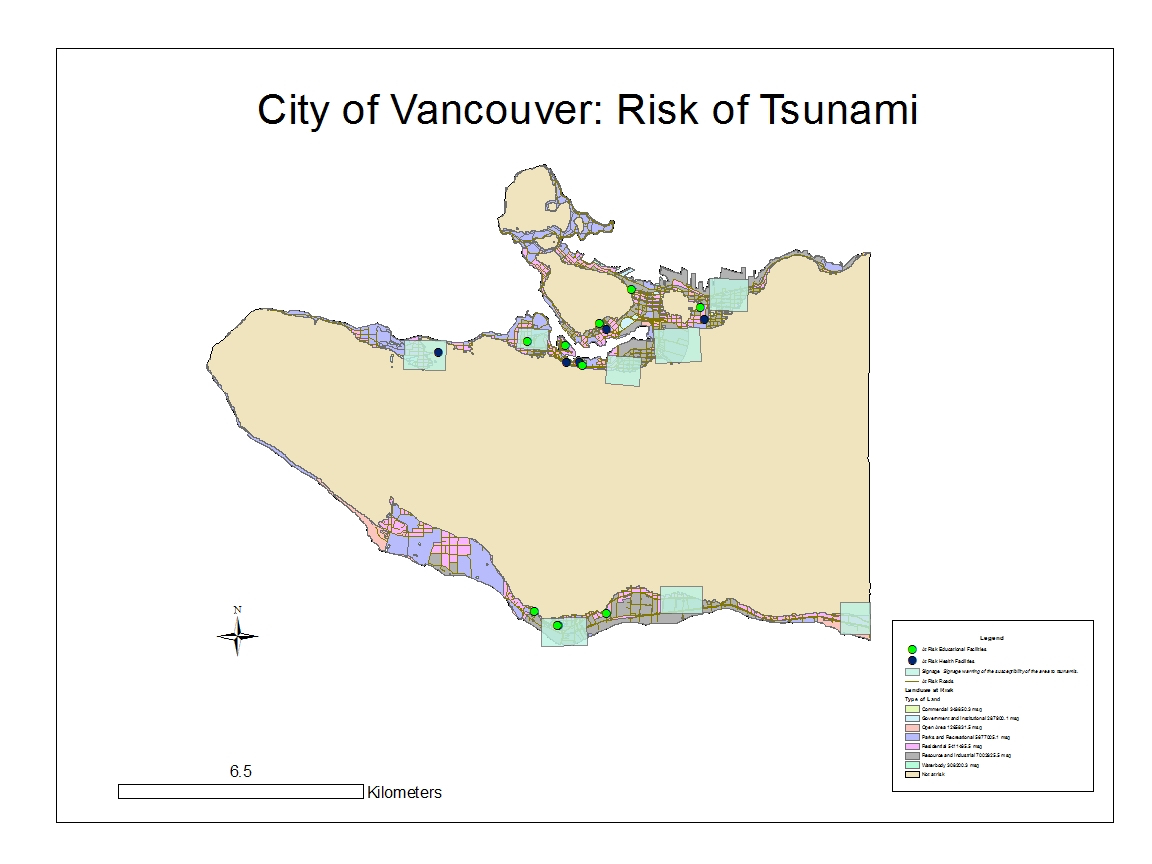
This GIS analysis looks at the risk of Tsunami in Vancouver, and identifies key features that are in danger if a Tsunami were to occur.
Project Notes
- 15.5% of the total area of Vancouver is under danger of a Tsunami. This was calculated by dividing the total land use of Vancouver by the land use in Vancouver that is in danger.
- To find the locations that are under danger, I used the “select by location tool” in ArcGis. I selected the educational facilities and health care facilities that fell in the source layer of “Vancouver_Danger”. Then, I created two layers that included the selected features of educational and health facilities. I viewed the attribute table of each of the new layers to create a list of educational and health facilities that are at risk of a tsunami.
The health care facilities in Vancouver that are under danger are:
False Creek Residence, Villa Cathay Care Home, Coast West Community Home, Broadway Pentecostal Lodge, and Yaletown House Society
The educational facilities under danger are:
Emily Carr Institute of Art & Design, Institute of Indigenous Government, Henry Hudson Elementary, False Creek Elementary, St. Francis Xavier, Vancouver Monessori School, St. John’s International, Heritage 3R’s School, St. Anthony of Padua, Ecole Rose Des Vents
Project accomplishment statements:
Refined skills in practical and routine procedures used in ArcGis.
Interacted and compared several types of coordinate systems and projections.
Worked with a database to compile and analyze spatial and attribute data.
Applied GIS knowledge to analyze risk of environmental damage on human society.
