Introduction:
The purpose of this assignment is to practice defining a technical term to a non-technical audience. Three types of definitions will be practiced: parenthetical, sentence and expanded. The term to be defined is meant to be relatively complex.
Reading situation:
A graduate student showing their published paper to their family is asked what the term ‘standard deviation’ means.
Parenthetical definition:
The data obtained had a high standard deviation (spread within the data set).
Sentence Definition:
Standard deviation is a statistical term for describing the amount of spread within a data set.
Expanded Definition:
Standard deviation is a central term used in statistics to describe a data set. A data set is a collection of data points grouped together in rows and columns according to the variables being measured. Statisticians need a way to compare these data sets and present their findings to others in a quick and uniform way. Data points collected from a study can either be very similar to one another, or, the data points could vary from an extremely low value to an extremely high value. Standard deviation is a way to describe the degree of spread.
Standard deviation can only be used to describe data with quantitative variables. A quantitative variable is a measured quantity with units. A qualitative variable on the other hand, does not have units, and is a category (De Veaux, Velleman & Bock, 2012). For example, the faculty of a student (Science) is a qualitative variable, whereas the height of a student (163 cm) is a quantitative variable.
The standard deviation is a powerful descriptor for the spread of data because it takes how far each data point is from the mean (the average) into account. Mathematically, standard deviation is the square root of the sum of the squared deviations from the mean divided by the number of samples minus one (Mendenhall, Beaver & Beaver, 2020). In Equation 1 shown below, σ is the standard deviation, x is a specific data point, μ is the mean, and n is the number of data points. The difference between a data point and the mean is squared, to preserve the size of these differences when the differences are negative. If the data was not squared, a negative and a positive number could be added together, thus cancelling out some or all of the difference between those two numbers.
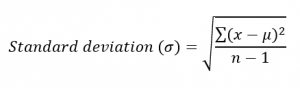
Equation 1: Standard Deviation Equation
The standard deviation is depicted below in Figure 1. The sum of the squared differences between a data point and the mean, x ̅, constitute the top half of the equation shown in Equation 1. Figure 1 shows that the sum of the horizontal lines is larger in data set 2 than in data set 1 (Yu, 2013). Thus, data set 2 has a larger standard deviation than data set 1. In other words, data set 2 has a larger spread amongst its data.
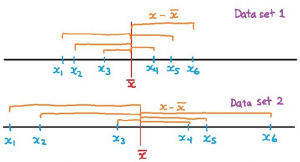
Figure 1: Standard deviation highlighting the difference between a data point and the mean (Yu, 2013)
Standard deviation is an important concept to understand in order to make informed judgements about data. A data set with a high standard deviation has a large spread of data points around its mean and should be viewed with more skeptical eyes. In contrast, a data set with a low standard deviation has a smaller spread of data points from its mean. In essence, the data points are more tightly clustered around the mean when there is a low standard deviation. When an alarming headline is published in the news, a reader educated in the term standard deviation will be able to read the study and understand what the data is showing and make more informed opinions for themselves.
References
De Veaux, R. D., Velleman, P. F., & Bock, D. E. (2012). Stats: Data and Models (3rd ed). Boston, MA: Pearson Education Inc.
Mendenhall, W., Beaver, R. & Beaver, B. (2020). Introduction to Probability and Statistics (15th ed). Boston, MA: Cengage.
Yu, Eugenia. (2013). Chapter 3: Displaying and Summarizing Quantitative Data [Class handout]. Department of Statistics, University of British Columbia, Vancouver, Canada.
Leave a Reply