This week in all the groups (land, air, and water) we focussed on obtaining three datasets each to provide to Chris Chafe to begin the process of sonification. These initial moments of gathering the datasets proved to be both challenging and exciting. In the air group we found aerosol, ozone, hurricane, and net national savings data. Overall, we had challenges when it came to find air-related environmental datasets that encompassed the time period between 1970 and 2019. We also had difficulty finding “positive” datasets that depicted some sort of silver lining amidst the current climate crisis. Nonetheless, the datasets we have found are quite unique and capture the current and past state of air-related phenomena pretty well.
Amelia decided to focus on 3 very diverse datasets. The first dataset looked the percentage of GNI that accounted for net national savings which includes the addition of education expenditure and the subtraction of energy depletion, mineral depletion, net forest depletion, and carbon dioxide and particulate emissions damage. I felt that this was a very important dataset given that net national savings is such a unique indicator of sustainability.
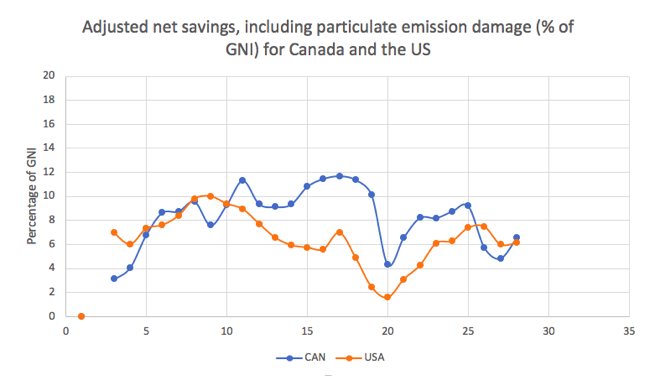
It highlights resource and environmental issues while also depicting the state of the economy. She also looked at the percentage of world energy output that is renewable and found that the upwards trajectory is not as significant as it should be given the climate crisis. The last dataset she looked at focusses on North Atlantic Hurricanes. This dataset depicted that hurricanes are increasing in both frequency and intensity. It will be interesting to see how the music in this dataset encapsulates this increase.
I decided to focus my data search on the ozone layer mainly to depict some positivity. I found a dataset on NASA’s website containing the area of the ozone hole in the South Pole. I had imagined that the resulting graph would show a downward trend, however it appears that there is a lot more variation than I had imagined. While the area rapidly decreased from 2015 to 2017, it had increased again from 2017 to 2018.
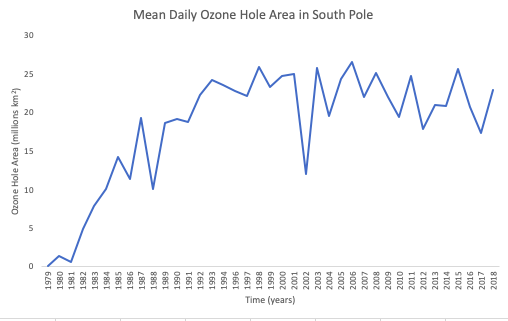
This was overall quite alarming to me. I also retrieved a dataset of the total ozone concentrations (stratospheric and tropospheric) in the South Pole. This dataset also showed a decrease in the ozone at the South Pole. For my last dataset I wanted to focus on concentrations of ozone depleting substances. I chose to focus on CFC-11 and I found that globally while there was a steady decline starting from 1990’s, in recent years the concentrations have been fairly constant. Ultimately, my data wasn’t as positive as I had imagined it to be, but I feel that it is relevant to include as I hope it will raise awareness about the state of the ozone layer.
Lilo chose to focus on aerosols data this week. Fortunately, she was able to access data that has not yet been realized. While her data was quite specific, she had several issues with the formatting and had to resort to using R which she is not quite familiar with. Nonetheless, she has been working extremely hard to graph the datasets in an efficient manner.
References
NASA. (2019). Ozone Watch. Retrieved from https://ozonewa tch.gsfc.nasa.gov/statistics/annual_data.html
World Bank. (2018). Adjusted Net Savings. Retrieved from http s://datacatalog.worldbank.org/dataset/adjusted-net-savings