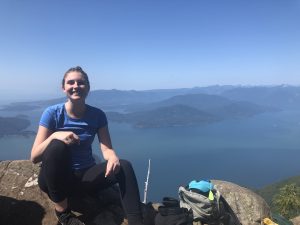
Strait of Georgia pictured in the background of St. Mark’s Summit, Cypress Provincial Park. (Photograph: Mikaela Bacon, taken August 2019.)
With the 50thanniversary of Earth Day coming up in April 2020, 9 undergraduate students are teaming up with Philippe Tortell (UBC Oceanography), Jonathan Girard (UBC Orchestra) and Chris Chafe (Stanford University, Music) to produce a musical piece created from environmental data sets over the past 50 years through a process called sonification. The UBC School of Music will perform this musical piece as a symphony. As the undergraduates, our role in this project is to collect and interpret the environmental data that will be converted into music.
We have divided into three main areas to begin our search for a wide range of environmental data – land, air and water. In this post, I will be summarizing the initial oceanic data collected and analyzed. We each had some ideas in mind when we began our search including marine pollution, Arctic sea ice, coral bleaching, sea surface temperature, average daily tide level, and salmon catch data. Each of us were responsible for collecting three data sets to provide to Chris Chafe and Philippe Tortell for a meeting they will be attending in Banff, Alberta on September 30th.
Although the ocean covers 71% of Earth’s surface, approximately only 5% has been explored. Each of us responsible for collecting oceanic data ran into issues because there is not a significant amount of data readily available, especially spanning the past 50 years. A lot of oceanic data is determined using models rather than actual observation.
Our summarized key findings are as follows:
Arctic sea ice extent– Arctic sea ice has been decreasing by an average of 12.8 million square kilometers each year. This data was measured by the National Snow and Ice Data Centre using satellites to measure the brightness and technology developed by NASA to convert the brightness into sea ice extent.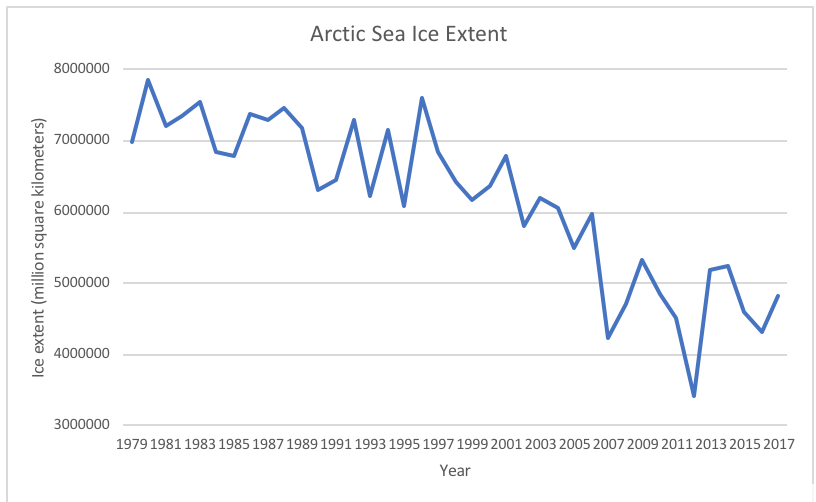
Microplastics in the ocean – The data set found was not ideal, but the tracking for plastic in the ocean is a relatively recent endeavour, so it was hard to find data sets that reached back 50 years.
Coral bleaching– When looking into coral bleaching data, it was very difficult to find quantitative data. Most of the data was intermittent for a variety of coral reefs around the world. Sediment data was explored instead. The sediment data examined showed the average mass flux a day, average organic carbon flux and average nitrogen flux for sediment at the BAT station in Bermuda. When plotting data with too many data points, there was toomuch seasonal fluctuation to notice a pattern.
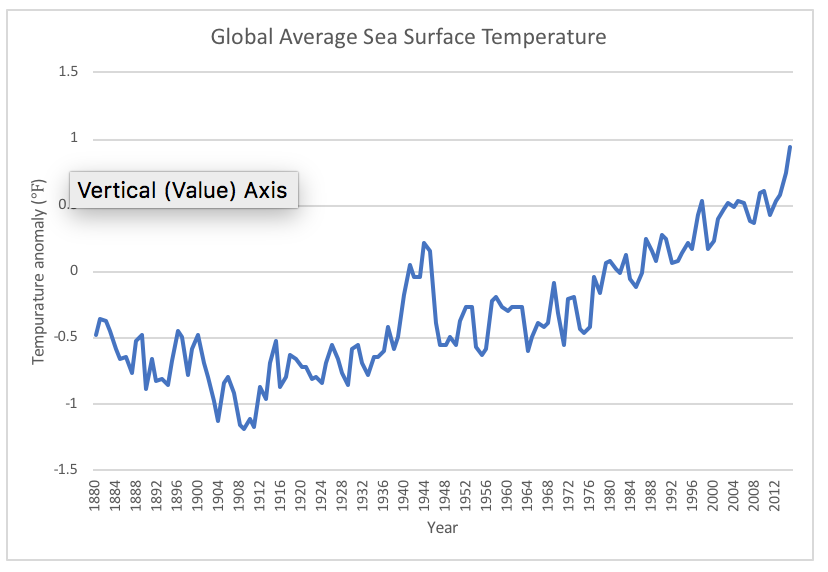
Sea surface temperature– Using reconstruction techniques, the data span from 1880 until present. While several different versions have been present in the past, the most recent version (5.0.0) has been improved using ARGO floats in the Southern Ocean and tropical regions. Meanwhile, ship and buoy data as well as improved modelling techniques have improved this version for the rest of the ocean. Overall, the data show that the sea surface temperatures are rising.
Tide level– Tide level data wasattained for Point Atkinson (station 7795). This data can be found on the Fisheries and Oceans Canada Database although it is originally calculated and published by the Canadian Hydrology Service. Some stations have data going back 60 or more years while some stations have less. This data is measured every 15 minutes by water gauges. However, only the hourly data is published and is averaged to daily and monthly means. Overall, sea level is indeed rising; however, from this gauge, there is no visible trend for Point Atkinson.
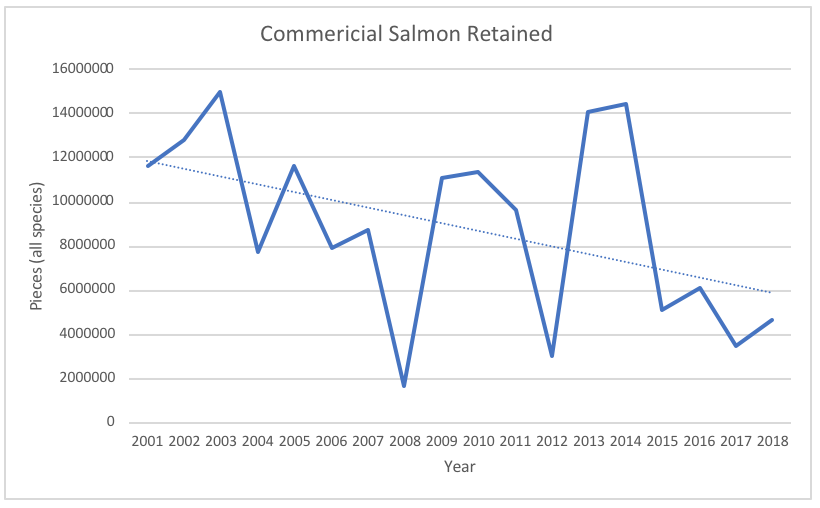
Salmon catch data– Pacific Salmon commercial catch data for all salmon species retained on commercial vessels (troll, seine, gillnet). The data showed that commercial vessels are retaining less Pacific Salmon as time progresses. Commercial catch data is a strong indicator of the number of Pacific Salmon returns which means this data can be used to understand the impacts of climate change on salmon returns in BC. A trendline was added to the graph below to show the decrease in catches.
As we continue forward in this directed study, we are hoping to uncover more oceanic data than we did in our initial findings. Stay tuned to see what we find next and follow us on this journey through these weekly posts!