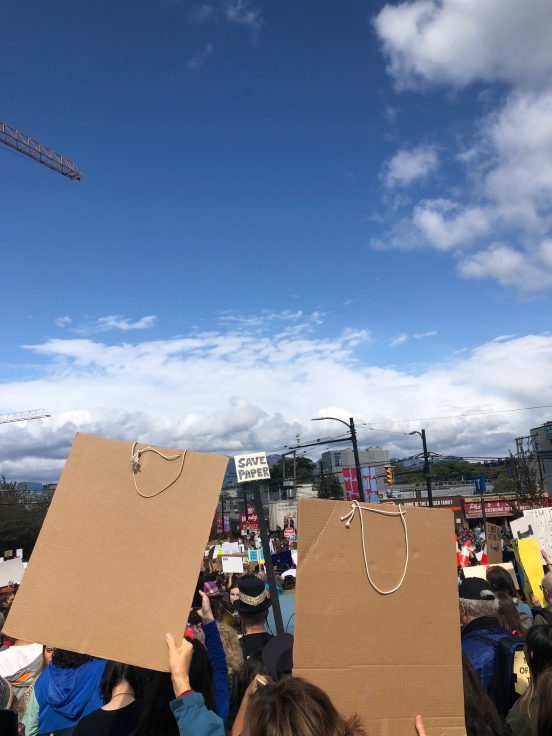
In the past week, focus was somewhat pulled from the research we have been doing to the climate action and Global Climate Strike that occurred at UBC as well as in the city of Vancouver in the past week. The turnouts for the strike were much larger than expected and the crowds were filled with young people and children who were all taking a stand, trying to make the environment a larger priority in the society we live in. It was a very hopeful moment, but also clearly far from the last time people will need to mobilize for the protection of the environment. There is still so much change that needs to happen and unless the people make it a priority, politicians certainly won’t.
We were not solely focused on the Climate Strike however, as some of us were starting to play around more with data and explore the best way that data can be communicated and shared. Ideally it should be presented so that it is both comprehensive but also easily legible by anyone, regardless of scientific background. All of the numbers mean very little if no one can make sense of them. We have also been continually searching for good data sets as an ongoing problem with finding climate data that covers the past 50 years has been that many of the environmental studies did not start until much more recently. “Air data” is typically thought of very simply as CO2 and ozone levels, but we have also been searching for data that relates to both the topic of “Air” and to the human impacts of environmental air issues. This includes finding data that looks beyond just ozone or CO2 levels and more directly at the anthropogenic sources of different greenhouse gasses.