This week, we continued our journey of collecting and analyzing data. Each of us found one new data set, and tried to identify different signals presented in one datasets.
In the air group, we looked at renewable energy percentage in the world, Canada’s NOx emission and NO3 concentration at South pole.
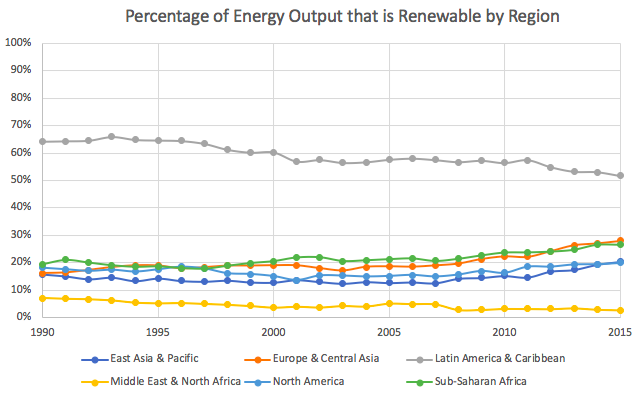
Amelia broke down the world’s renewable energy output by regions. From 1990 to 2015, the world’s renewable energy percentages fluctuate slightly around 20%. When it breaks down by regions, Latin America and Caribbean has the highest percentage of renewable energy, from over 60% in 1990 to 50% in 2015. All the other regions have renewable energy percentage less than 20% before 2010, with Europe and Central Asia’s and Sub-Saharan Africa’s renewable energy percentage increased slightly to close to 30% in 2015. However, one needs to be careful when analyzing those data, as the amount of renewable energy being used by each region may not reflect the level of investment they put onto renewable energy. For example, the high level of renewable energy used in Latin America and Caribbean region might be from their inherent access.

Jasmin found a compiled list of all signals contributing to the NOx emission in Canada. Unsurprisingly, road transportation is the most significant signal in NOx emission since 1970 (30% in 2010), based on the amount of vehicles used. Other prominent signals include public electricity & heat (16% in 2010), manufacturing industries and construction (14% in 2010), inland navigation (8% in 2010), and from rail transportation (5% in 2010). Smaller NOx emissions are from residential sectors, soil emissions, domestic aviation, agricultural waste burning, and waste incineration. It is reasonable that electricity and heat contribute a lot to the NOx signal considering the large amount of energy put into heating system during winter time.

I looked at the NO3 concentration at coastal Antarctica specifically. Nitrates mainly from snow vaporization, precipitation and direct emission. Growing anthropogenic NOx emission contributes to NO3 concentration: The global circulation of NOx contributes to the observed coastal Antarctica NO3 level. HNO3 concentration also increases in precipitation, which precipitate out as NO3, and evaporates from snow. However, I cannot find the breakdown signal, and more research is needed to determine the magnitude of each signal in the observed NO3 concentration.
Reference
Source: World Bank, World Development Indicators. (2018). Renewable electricity output (% of total electricity output) [Data File] Retrieved from https://data.worldbank.org/indicator/EG.ELC.RNEW.ZS
EDGAR. (2016). Global Emissions EDGAR v4.3.1. Retrieved from https://edgar.jrc.ec.europa.eu/overview.php?v=43 1#
Weller, R., Wagenbach, D., Legrand, M., Elsässer, C., Tian-Kunze, X., & König-Langlo, G. (2011). Continuous 25-yr aerosol records at coastal antarctica – I: Inter-annual variability of ionic compounds and links to climate indices.63(5), 901-919. Retrieved from https://www.tandfonline.com/doi/pdf/10.1111/j.16000889.2011.00542.x?needAccess=true&