The original Golden Record networked data set from the class is initially an interesting visualization, but it shows only weak potential with a display of random connections between nodes based on personal choices that were completely free. Larger nodes indicate busier traffic intersections where songs were selected more frequently, but why those bottlenecks occurred and what the traffic rules were are largely unknown until we read through our peers’ rationales for musical salvation.
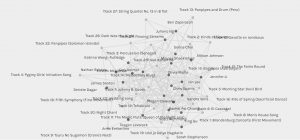
Palladio was designed as a tool for reflective practice, meant to visualize complex historical data. As far as data sets go, this one is not very complex. We know that 23 students selected 10 songs each from a set of 27 tracks. Unfortunately, we do not know what methods were used to determine inclusion and exclusion. Palladio does allow us to see each target and source and that they connect. That is not uninteresting, but the tool cannot tell us why a person made a selection or how they felt about erasing part of the historical record when doing so. Had other standard dimensions been set up at the start, we might assume the graph was intended to do something.
Sizing the nodes makes the visualization more interesting, showing which songs are more favoured by greater number of students.
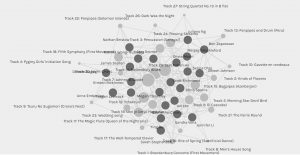
Selecting “Sum of modularity_class” seems to show that Track 4 is an orphan, meaning it has the weakest (or no) connection in the group.

I use a similar graphing tool at work to visualize knowledge graphs. In my professional context, knowledge graphs are meant to do something; they support student learning by providing a personalized learning path based on mastery. By connecting one node to another, or pre-requisite and post-requisite knowledge (learning objectives) with a Strong or Weak connection and including a Justification, we see a different type of picture:
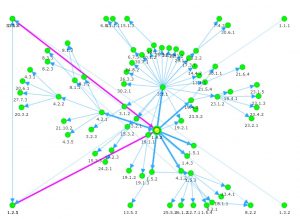
Edges are a relation of some sort between two nodes (a nice description by Systems Innovation, 2015 April 18 and April 19). The visualization above serves a few purposes. It shows that one chapter.section.objective node may be connected with other chapter.section.objective nodes with a Weak justification as shown by narrow lines (e.g. mastery of the objective is not completely dependent on having prior knowledge of another node, or pre-requisite edge), and Strong justification as shown by thick lines (e.g. mastery is dependent on understanding a prior objective/node, and success on the following objective/node similarly relies on that knowledge). It’s an algorithm based on a variation of item response theory that is eerily similar to Amazon’s recommendation engine, where a weak link between nodes is where we see that other people were interested in X, while with a strong link we see people who purchased that book on Stoicism also bought Y.
The Palladio experiment does indeed enable reflective practice; however, it is missing the power of nodes. What might this activity look like if we added Strong and Weak dimensions with clearly defined categories for justifying one over the other link, and what if we left in the remaining 17 songs to visualize which are orphaned? We might get a closer glimpse into rational decision making about the historical record (or trash bin) if we justify links between nodes by indicating dimensions like key signature, tempo, time signature, and type (classical, jazz, rock, blues, percussion, string, orchestral, instrumental).
Systems Innovation. (2015, April 18). Graph Theory Overview. Retrieved from https://youtu.be/82zlRaRUsaY
Systems Innovation. (2015, April 10). Network Connections [video file. Retrieved from https://youtu.be/2iViaEAytxw