
Initially, taking a peek at the first file sent to us, I struggled to find my name, but was thankful to see my name in the other section’s file! As a result, I did analyze both graphs thoroughly. I analyzed Section A graph by following paths and walks of the graph (Systems Innovation, 2015). I found this was strategic when trying to interpret the data. Seeking meaning and connection amongst my colleagues, I noticed the following:
1) First, I recognized that I belonged to Community #2, alongside the following students: Emily MacDougall, Alexis Reeves, and Sophy Chu. The below screenshot is the isolation of just our community 2. One can observe my significance within this network when finding the node that is representative of my name.
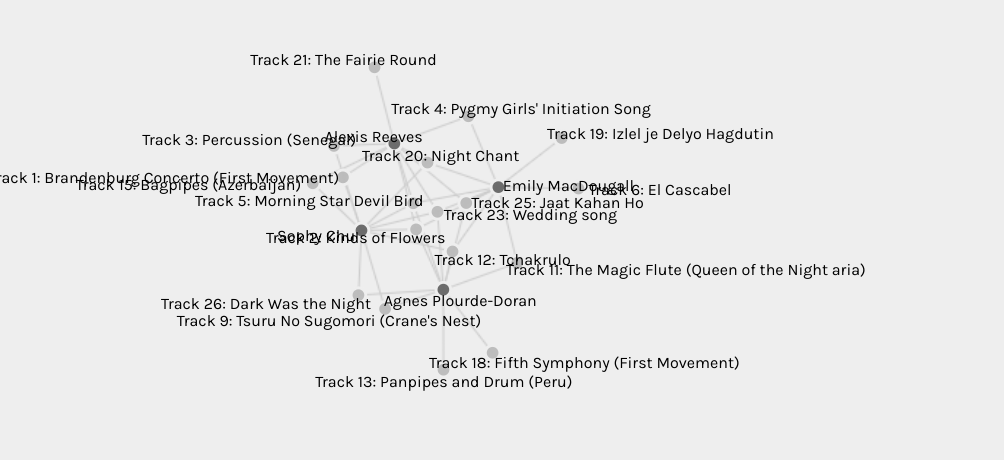
2) Adjusting the facet filter, I observed the target totals and was able to view the nodes (track #’s) that were not significant in our group. These were tracks 17, 27, 8 and 10. Surprisingly, I did not select any of those. A question I am left wondering is, why others did not select those as well? In System Innovations (2015), they mention that connectivity significance is not always positive. This made me ponder that what if these unpopular choices that were made, were in fact better choices, that were not made by the rest of us? What if it is better to be an outlier in data?

In addition to that thought, I reflected on the learning we did this week on search algorithms. I considered that maybe there are fantastic websites that provide excellent information that is overlooked by algorithms, because of limited access. and unpopularity. Maybe the algorithm believes that a particular result is not relevant to me… but what if it is? What if we had some choice in what is relevant? For instance, I like when Facebook offers the option to see more of certain posts, or less of certain types of posts. I feel a bit slighted that I may be censored from information because of algorithms. That is where the political piece comes in. Yes, with machine learning, algorithms evolve independently, but there are still humans in charge of these algorithms with distinct political preferences, beliefs, and cultural perspectives. How (or can we) ensure that algorithms remain free from political agendas?
3) I found the graph was limited because I would have had to consult with my colleagues’ Task 8 blog posts, to view their reasoning for their selections. I was not able to decipher their reasoning using the Palladio graph alone. If we completed a google form as a section, then we offered a reason attached with our choice, then given access to the master google spreadsheet, we could then select a track title, and view the frequency of it, and view a short answer of their reasoning. That may have been a way of understanding the reasoning of the selected choices.
However, it could still be possible within this Palladio graph if there were other nodes that were included in the graph ie. for generic reasons, location etc., that would provide more edges to translate connections.
4) From a cultural perspective, maybe other students chose selections that they recognized or based on traditions of their cultures. It would be important that we had classmates that were from different parts of the world to offer their input on what we put on the Golden Record. There certainly is bias present if all participants are from North America or a certain section of Canada. We all are pursuing higher education and part of the same MET program, so that may produce a particular similar perspective in some respects.
References
Systems Innovation. (2015, April 19). Network Connections [Video]. Youtube. https://youtu.be/2iViaEAytxw