
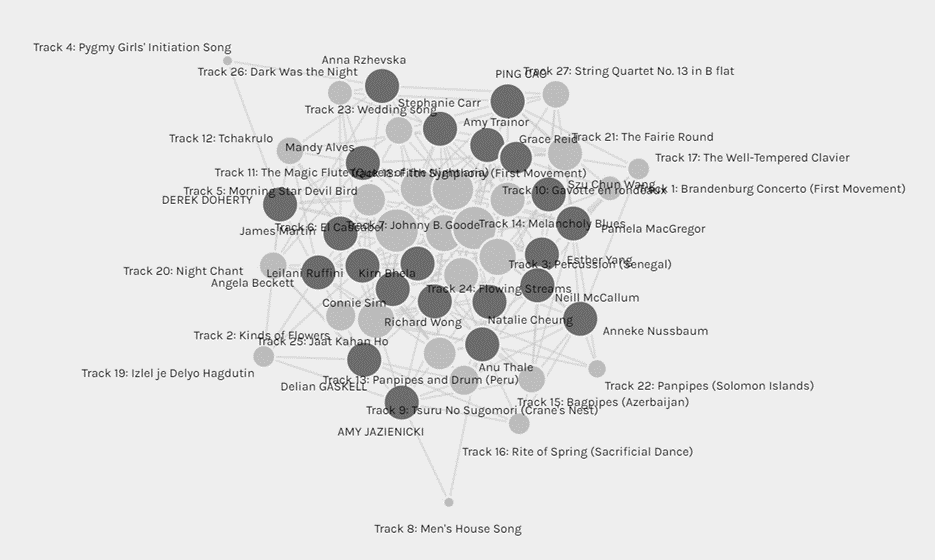
Screenshot: Unfiltered Data
At first glance, this visualization representing everyone and their selected tracks is quite complex and even indiscernible insofar as ‘edges’/’relations’ (Systems Innovation, 2015) are concerned – it is not easy to see who selected which tracks. The individuals and tracks are numerous and are both represented as ‘nodes’ (Systems Innovation, 2015); the resulting visualization gives the impression of great complexity for the reasoning behind everyone’s track choices, but the tool cannot detect these reasons. In our blog entries, we were required to specify our reasoning for our choices; however, the tool is not configured to account for this more nuanced “criteria”. This visualization depicts only a very high-level impression of which tracks might have been selected with greater frequency when compared against others.
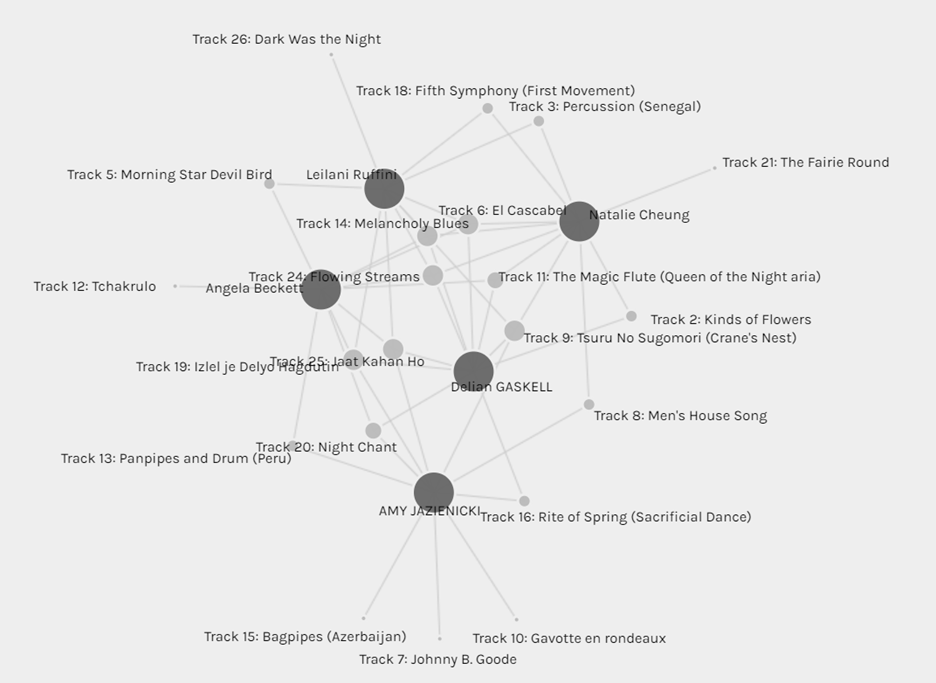
Screenshot: Community 3
When I selected the ‘Community 3’ grouping, it became easier to at least discern who selected which tracks since these individuals’ choices had a fair degree of overlap. Even with this increased clarity however, the reasoning behind everyone’s choices is not indicated in the visualization. At best, we could only speculate as to why some track nodes have greater ‘Degrees of Connectivity’ (Systems Innovation, 2015) when compared with others. In the visualization above, tracks such as ‘Melancholy Blues’, ‘El Cascabel’ and ‘Flowing Streams’ were frequently selected, whereas tracks such as ‘Bagpipes’, ‘Johnny B. Goode’ and ‘Dark was the Night’ were less frequently selected. These selections have great degrees of variation when it comes to instrumentation, vocals vs. no vocals, cultural origins, etc. The only speculation I would make with this data set is that perhaps diverse cultural representation was an important factor for many of us in this exercise. However, without reviewing everyone’s blog posts to provide context for their track choices, it is impossible to know simply from this visualization alone. By extension, “null” choices also cannot be explained without this qualitative context – even then, I doubt that everyone specified why they didn’t select specific tracks in their blog entries. Also, some choices might simply be reduced to much more subjective and even arbitrary criteria, such as simple personal preference.
┏━━━━━━༻❁༺━━━━━━┓
With respect to political implications, how everyone perceives what “represents” humanity through song could be vastly different due to varying biases, worldviews, experiences, and even aspirations. This, of course, is not to suggest that any of these things would result in “wrong” choices, but rather it would be very illuminating to understand the nuance behind everyone’s choices: of course, how we perceive (and engage with) cultural diversity permeates other aspects of our lives outside of an exercise such as this.
Additionally, how data is used for organizational and predictive purposes impacts our perceptions not only of the data in isolation but of the wider world. For instance, the ‘Community 3’ grouping could serve as a microcosm for what we colloquially refer to as “echo chambers”: online communities that propagate views and opinions we already agree with. Social media and search engines operate algorithmically and tend to generate information that it predicts we would be interested in and “align” ourselves with. However, the original screenshot of everyone’s choices could also serve as a microcosm for openness and curiosity when it comes to gathering and interpreting information about the wider world.
Ultimately, I’d make the case that this exercise has emphasized the great need for critical thinking in data literacy. When confronted with such information, it is crucial to ask questions such as:
“Who/Which organization generated this data?”
“What are the explicit and implicit assumptions made in the data set(s)?”
“What other sources could I consult to view this data through a ‘Big Picture’ lens?”
References
Systems Innovation. (2015, April 18). Graph Theory Overview. Retrieved from https://youtu.be/82zlRaRUsaY
Systems Innovation. (2015, April 19). Network Connections. Retrieved from https://youtu.be/2iViaEAytxw