
This song selection visualization shows our selections as an unweighted network. “Within networks, how connected an individual node is becomes a key metric of its significance within the network”, so how commonly selected a Golden Record song could be interpreted as that song’s significance (Systems Innovation, 2015). However, I think this type of data visualization does not articulate qualitative selection factors. For example, while we were all ultimately curating a selection of the songs on the Golden Record, there was no unifying approach to how we ranked them so it’s difficult for me to determine just what conclusions we could raise from this data set.
Before thinking more about drawing conclusions, I thought of investigating the data. It appears that Shannon Wong, Stephanie Takeda, Abdulehed Yarkin and I each had five selections in common so their criteria compared to mine might provide an interesting vector to approach this data from.
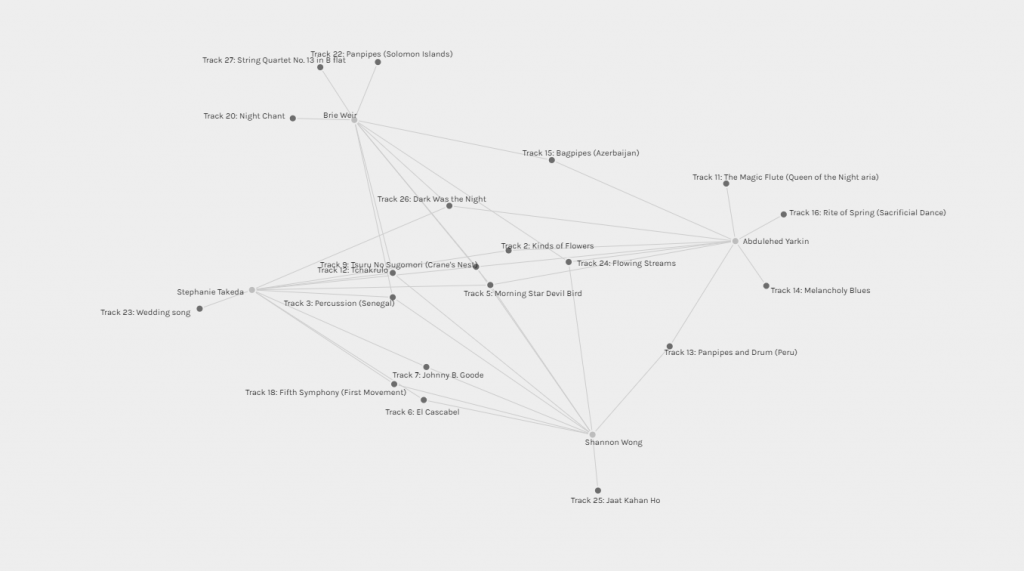
I looked at Shannon’s webspace and saw that we did not use a similar sorting mechanism to curate our lists as they worked off geographical representation as a sorting structure (Wong, 2024). Stephanie and I came at this task completely at odds – they note “my decisions were primarily based on criteria other than personal preference” which is at direct opposition with how I just selected based on my own preference (Takeda, 2024). Abdulehed and I were on a somewhat similar approach– as part of their sorting algorithm Abdulehed ranked pieces with higher emotional impact as higher (Yarkin, 2024). While I didn’t take that exact approach there’s more common ground there than with Stephanie and Shannon’s approaches.
After exploring the posts of those I had a lot in common with I wondered if I could filter the visualization to show me who I didn’t have anything in common with. Filtering by “source” gave me another vector to play with the data. It appears I have a selection in common with everyone in the class, but Tina Wei and I are the least networked – only “Dark was the Night” joins our curated lists together. What I found funny about this is that “Dark was the Night” is my far away favorite track on the list!
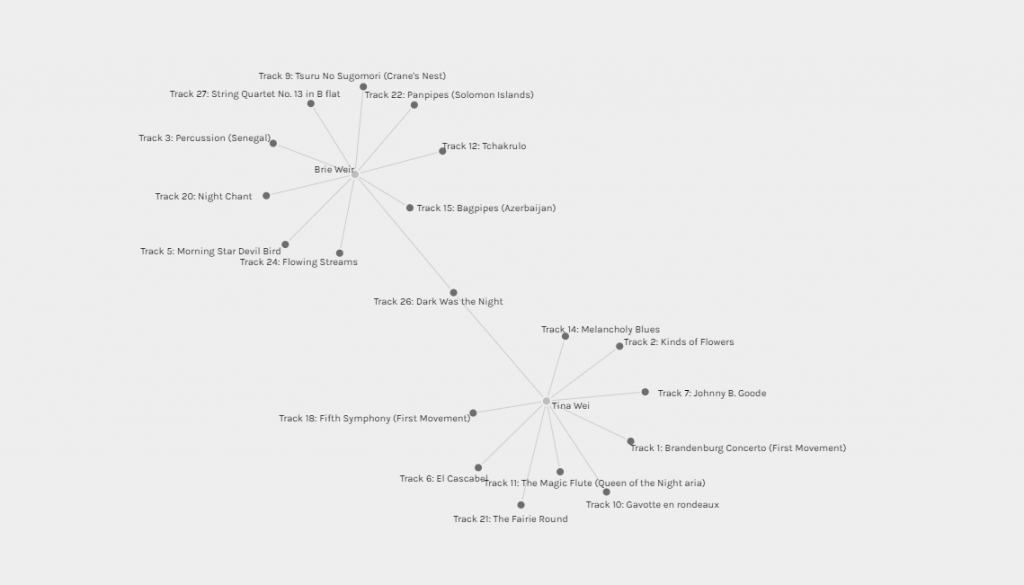
I read Tina’s post about selection criteria and our algorithm did have much more in common than the criteria of the colleagues that I had more selections in common with. Tina and I both leaned into the subjective and made selections without a logically consistent selection framework (Wei, 2024).
I find myself again thinking about Linda Salzman Sagan’s reference to the “ridiculous and the sublime” when selecting songs for the Golden Record (Taylor, 2019). Those who I have selections in common with, I don’t have criteria in common with. Those who I don’t have selections in common with, I do have criteria in common with! It’s getting muddier and muddier for me to try and draw conclusions from this data.
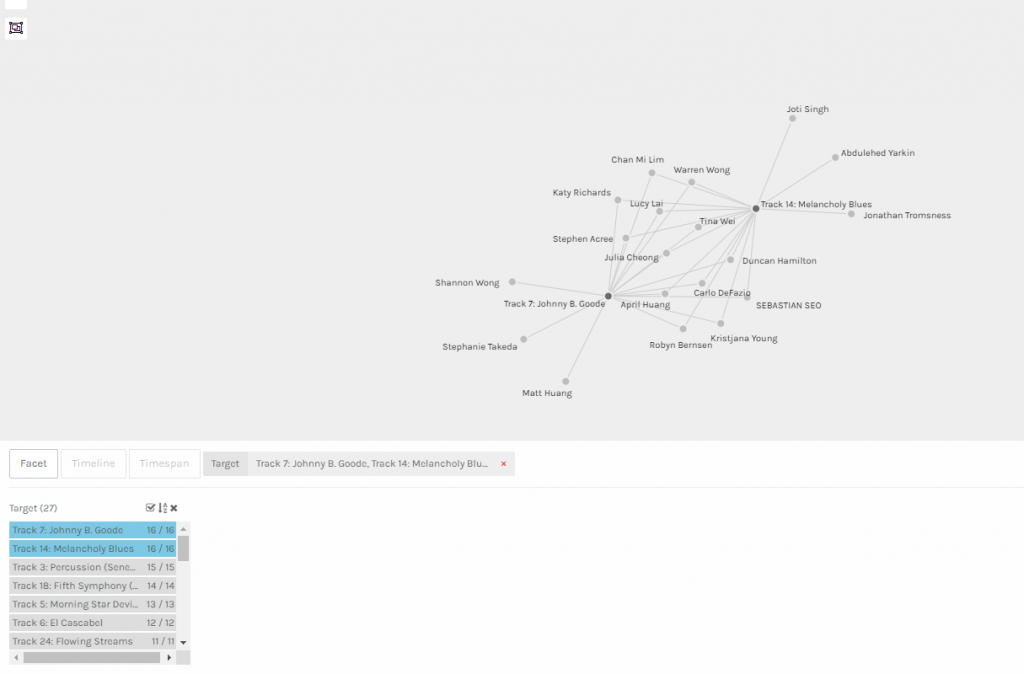
Looking for another way through, I filtered to find the most popular tracks. Melancholy Blues and Johnny B. Goode are the most selected songs with 16 students selecting them. Does that reflect the dominant mode of cultural production in our contexts, or personal taste, or are these just objectively the best songs to represent humanity to a new form of life?
Re-listening to Melancholy Blues (ugh, maybe I should have selected it) and scrolling through the YouTube comments I’m shocked that they are largely positive and happy, anticipating a new audience for Louis Armstrong, assured of the positive reception of this song, excited that Louis Armstrong’s work and output get to live on in space (Lunathicka, 2010). Another possible motivating factor for song selection enters the fray – not possible reception of the song, but some occult math that could be used to calculate how deserving the artist is of their work being preserved and shot into space.
As an aside – I was driving back from Kelowna last weekend, baking in the heat, and talking to my husband about the original Golden Record task. We talked through what we would do if we had to do the Golden Record from scratch all over again. He’s adamant that the best approach would be to take most chart-topping hits from the last X number of years. I’m aghast at his suggestion, that what we can afford to lose is the already underrepresented voices, he argues that the point of the task is already accomplished by song popularity. Ultimately, we agree that the task leans into the absurd and that we’ll just have to approach it differently if either of us is called upon to curate Golden Record 2.
So, after much looking around, poking and prodding, talking and arguing, I return to the original questions of the prompt. This visualization cannot capture why selections are made in this context; I think partially due to a lack of common decision-making algorithms. I believe there is an opportunity to collect additional data around the songs that were emphatically not selected – an inversion of the selection task where you eliminate songs may be an interesting way to make a contrasting data set from which you could draw conclusions around which songs are controversial or polarizing. This type of visualization helps to articulate the quantitative but does not involve the qualitative which on a deeply individual task like Golden Record curation means the missing data has a deep impact on the conclusions that can be drawn.
References
- Lunathicka. (2010). Voyager’s golden record: Melancholy blues_Louis Armstrong and his hot seven {Video]. YouTube. https://www.youtube.com/watch?v=T9BC5PY_OaM
- Systems Innovation. (2015). Network connections [Video]. YouTube. https://www.youtube.com/watch?v=2iViaEAytxw&t=48s
- Takeda, S. (2024). Task 8: Golden record curation. ETEC 540 Webspace. https://blogs.ubc.ca/stephtakeda/2024/07/07/task-8-golden-record-curation/
- Taylor, Dallas. (Host). (April 2019). Voyager Golden Record (No. 64) [Audio podcast episode]. In Twenty Thousand Hertz. Defacto Sound. https://www.20k.org/episodes/voyagergoldenrecord
- Wei, T. (2024). Task 8. Wei to Education. https://blogs.ubc.ca/thisisthewei/task-8/
- Wong, S. (July 2, 2024). Task 8: Golden record curation assignment. Shannon’s Blog. https://blogs.ubc.ca/shannonwong/2024/07/02/task-8-golden-record-curation-assignment/
- Yarkin, A. (July 5, 2024). Task 8: Golden record curation. Abdulehed’s ETEC 540. https://blogs.ubc.ca/akyar540/2024/07/05/task-8-golden-record-curation/