The Program
The Palladio program seemed a little overwhelming at first and I was not quite sure where to begin with this analysis of the visualizations. I played around with the count and dimensions for quite some time and settled on using what made the most (or any) sense to me based on the fractions in the selected targets and the visualization. I based my analysis using the count of “number of nodes” and added the dimensions of “modularity class, “target”, and “source” to analyze.
Modularity Class
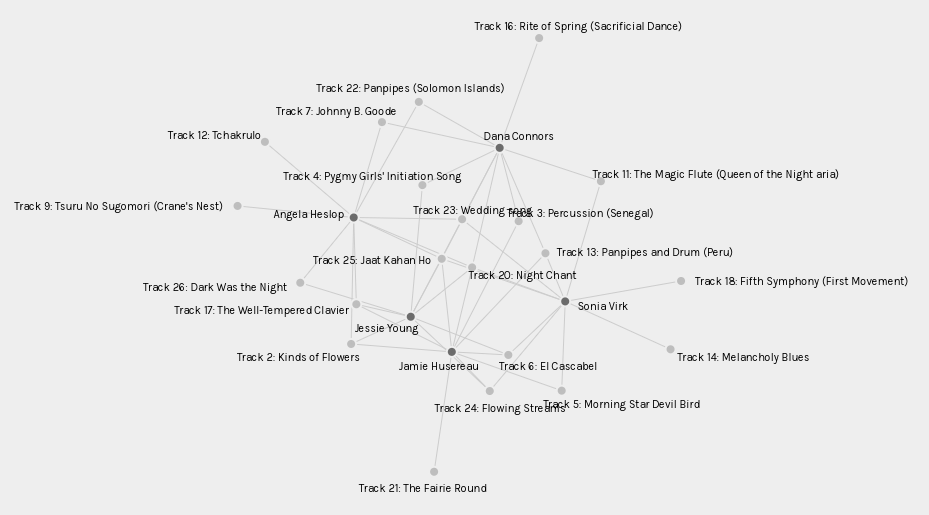
The Palladio program set up 5 modularity classes for our section participants. This is where my comparisons will start. I was organized into modularity class 2, a group with Angela, Dana, Jessie, and Sonia. All 5 of us chose Track 20: The Night Chant and Track 25: Jaat Kahan Ho. If I move along to the other similarities I had with other group members; I shared Track 6: El Cascabel with Jessie and Sonia, Track 5: Morning Star Devil Bird with Sonia, Track 3: Percussion (Senegal) with Dana, Track 24: Flowing Stream with Jessie and Sonia, Track 13: Panpipes and Drum with Dana and Sonia, Track 17: The Well-Tempered Clavier with Angela and Jessie, and Track 2: Kinds of Flowers with Angela and Jessie. Track 21: The Fairie Round was not shared with any of my modularity class members.
All Sources
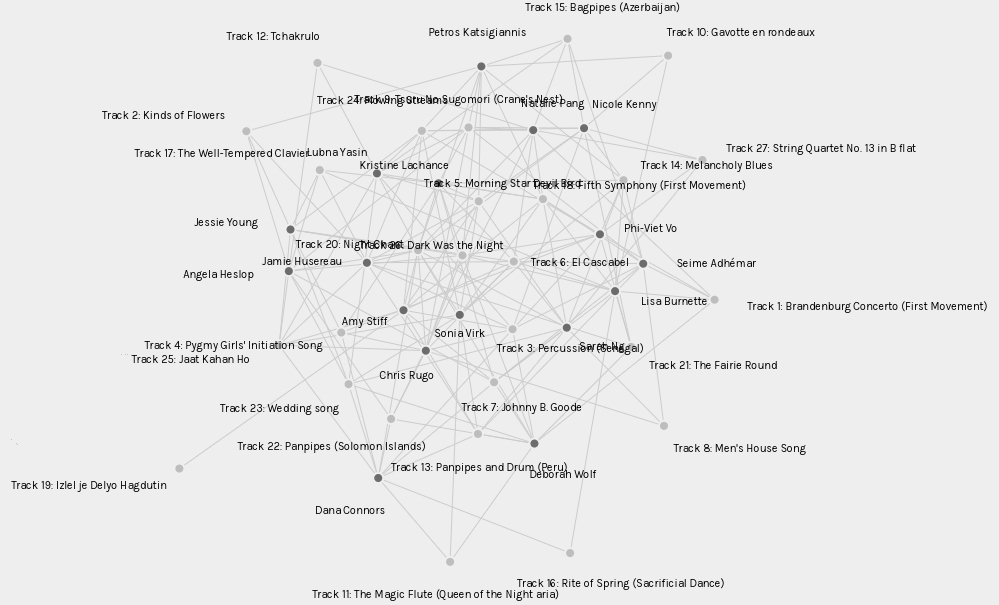
Now, if I compare my choices with the choices of the entire section, I find 14 out of 17 participants chose Track 20: The Night Chant, 11 chose Track 6: El Cascabel, 9 chose Track 5: Morning Star Devil Bird, 9 chose Track 3: Percussion (Senegal), 9 chose Track 24: Flowing Stream, 8 chose Track 25: Jaat Kahan Ho, 7 chose Track 13: Panpipes and Drum, 5 chose Track 21: The Fairie Round, 5 chose Track 17: The Well-Tempered Clavier, and 4 chose Track 2: Kinds of Flowers. This tells me that my choices are more mainstream than other choices, I chose none of the songs that indicated source ratios of 3 or fewer people from the class choosing it.
My Targets

If I select the visualization of my 10 targets (the 10 records I chose) I share something in common with every source (every participant), which isn’t surprising as 14 of us chose Track 20: The Night Chant. My target choices compared to each source is as follows; 4 shared with Angela, 5 shared with Chris, 4 shared with Dana, 4 shared with Deborah, 6 shared with Jessie, 4 shared with Kristine, 3 shared with Lisa, 5 shared with Lubna, 3 shared with Natalie, 5 shared with Nicole, 4 shared with Petros, 4 shared with Phi, 4 shared with Sarah, 3 shared with Seime, 6 shared with Sonia, 7 shared with Amy. This tells me I have the most in common with Amy and the least in common with Lisa, Natalie, and Seime. This also gives me a little insight into why I was in a modularity group with Jessie and Sonia, indicating that they must have had similarities with the other members (and so on and so forth) to be grouped in such classes.
Reasoning
The visualization creates communities of individuals with similar responses, as indicated by the modularity class, or by selecting visualizations with specific targets or sources to see the links and connections between participants and record selections. As for capturing the reasoning behind the choices that participants made for record selection, I only know my true reasoning as highlighted in task 8. The visualization gives no indication and does not reveal why participants made their choice or selection of various tracks. However, can my (or others’) choices (or non-choices) be interpreted (or misinterpreted) by this data?
Political Implications
If I were to step into a different mindset than the one that I approached this task with, I may be able to view this data through a more judgemental (maybe even pessimistic) lens to see if I can decipher choices that may be racially biased, gender imbalanced, xenophobic, and even religiously or politically discriminating based on geographical location and my knowledge of various countries. For example, did I exclude (and only 2 of 17 participants chose) Track 16: The Rite of Spring (Sacrificial Dance) because it was written by a Russian composer and I do not agree with “their” war on Ukraine? No, I didn’t, I genuinely did not like the song and chose to include others from Europe. Buuuuut, data may be interpreted this way, especially during such times of chaos and unrest. In the same vein, did I along with 13 other participants, chose Track 20: The Night Chant, a North American Indigenous record, because we believe in Truth and Reconciliation or the importance of Indigenous representation or celebrating those who have been stewards of our land for time immemorial? Maybe, or maybe we genuinely liked the song and the instruments, or both. Does this mean 3 participants do not believe in my previous statement? Likely not, buuuuut again, data can be misinterpreted in ways that may misrepresent us and our beliefs if improperly analyzed.
Final thoughts
My previous comments were not written to offend anyone but just trying to bring light to the implications of misinterpreting data, which can potentially happen even through simple tasks as we have just done. Misinterpreting data can lead to misrepresenting people. This could have grandiose effects. I think another interesting task would be to analyze the original record choices, I am sure we could misinterpret a lot through this as well; why are there 6 pieces included from North America and only 1 from Africa? Why does Bach have 3 pieces and Beethoven only 1? Why are the only pieces from South America both from Peru? There are many questions we can ask (or not ask), and many assumptions (and judgments) we can make when we analyze data without knowing the genuine intentions of selectors.
References
Music from Earth. (n.d.). NASA.
Palladio. (n.d). https://hdlab.stanford.edu/palladio-app/#/visualization