The main takeaway for me from this week’s readings and assignment was how “AI-informed” decisions are not as objective, fair and mathematically sound as they seem, and how dangerous it can be to rely on it to make important decisions such as in policing, paroles, approval for a loan, hiring, admission, etc. without realizing how these machines were trained in the first place. Not only are these mathematical models usually hidden and inaccessible, they are programmed in a way that most people cannot understand. As Dr. O’Neil mentioned in her Google Talk, there is bias in the data you train your algorithm on and your definition of success imposes its agenda into the algorithm. Such algorithm training, under the guise of mathematics and technology, regurgitates the inherent bias that it was trained on, leading to further inequity and widening of the societal gap. This task reminded me of this game called ‘Survival of the Best Fit’ (https://www.survivalofthebestfit.com) which addresses machine bias in hiring practice. You would think that a machine would be less discriminatory compared to a human interviewer who comes with their own bias and preference based on their experience. Aren’t these automated decision-making supposed to make decisions objectively based on facts only, without discriminating against race, gender, age, etc.? Wrong. As predictive policing has shown, the data it gets fed and the consequent feedback loop comes with bias that has been passed on. But now under the guise of technology and mathematics that makes it even harder to detect and address. In the Detain/Release task, I couldn’t help but be heavily influenced by the predictive risk rating. Every time I saw a red colour, especially under violence, I clicked Detain. Halfway through, I thought I would change my strategy and detain/release based on the crime they have committed without looking at the predictive information. But it is hard to flat-out ignore these “AI-informed” suggestions and I can see how decisions may be swayed based on what “data” suggests.
Monthly Archives: July 2024
Task 10: Attention Economy

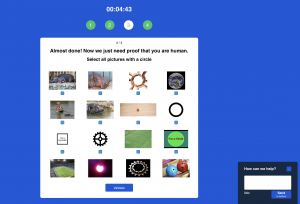
Wow. That was not a pleasant experience.
I almost gave up at the first screen when I got locked out and couldn’t close the “Hurry up. Time is ticking!” screen. Everything in this game seems to be against my intuition and the opposite of user-friendly. The buttons are not what I expect it to be. The wordings are twisted so it requires me to read it a second time. The placeholder in fill-in-the-form requires manual deletion. The scroll bar for the age is impossible to calibrate. The instructions for the picture selection are vague and the bottom row does not have checkboxes for me to click. And so many more frustrating features. This design seems almost malicious in a way that I would’ve gotten angry and left the site if it wasn’t for this assignment.
Despite its poor design, it is effective at keeping me on the website longer than it would’ve if it wasn’t all twisted. In the current attention economy where our phones, computers, smart watches, TV, etc. are all competing for my attention – the stakes are higher and people who design these technologies/features/apps know how our brain works. For example, the language learning app or fitness app on the phone rewards if you keep up streaks. It “punishes” by resetting to zero if you miss or skip a day. Instagram automatically inserts suggested content into my feed based on my search history and interaction. I remember watching The Social Dilemma years ago and being creeped out at how much detail and information is being tracked by social media. The number of seconds I stare at content or how fast I respond to someone all gets put into the computer configuring who I am and what will trigger me to check the app. If such demographic data is put into the wrong hands, it can be used for dangerous activities such as targeted political agendas or election campaigns where a specific stream of information is shown to the user. Compared to posters or propaganda people would post on the streets back in the day, we carry our advertisement screen with us all day and answer every time it beeps or dings, which makes it even more dangerous. I don’t know if there is any data yet but the way we interact with technology will have an impact on our brain and our attention span.
Task 9: Network Assignment Using Golden Record Curation Quiz Data
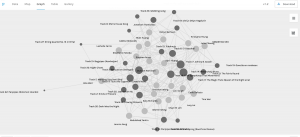
The data collected from Task 8 is visualized as above using the Palladio app. The tracks are highlighted as darker nodes and its size indicates its popularity. For example, tracks 3, 5, 7 and 14 are represented with bigger nodes – meaning it was selected by many students. The link/edges show the relation between the tracks and students. I tried isolating one node but whenever I move it, the whole structure moves in response. The same goes for the students’ nodes. Like a web, the students are linked through their common selection or shared interests, even though they may not know each other or realize they are connected. This reminded me of algorithms on YouTube or Instagram. When we view a post or watch a video, the system keeps track of my choices/preferences and uses it to make future recommendations. However, it does not know why I chose to watch that video specifically – my reasoning or motivation. Why I chose these tracks are most likely to be different from other students. However, the network paradigm is unable to differentiate. It makes predictions based on patterns shown by previous users, which brings up significant issues. Firstly, is the content accurate? Is it biased? The algorithm is unable to carefully sort out the quality of content to ensure accuracy, and a well-thought-out and balanced view. “Within network, how connected an individual node is becomes a key metric of its significance within the network” (Systems Innovation, 2015). In other words, how much the node/content is clicked, viewed, retweeted, or mentioned may influence its significance regardless of what the actual content is. Usually, controversial content receives the spotlight on social media. This can be problematic in the spread of false news or misused in political campaigns – as in the Cambridge Analytica scandal a few years ago. It also reminded me of how Google intentionally focused on official sources such as government websites and public health officials at the top of the search along with its credentials during COVID-19, because almost everyone was searching at home trying to gather information and the accuracy of information was ever crucial. Moreover, such data visualization does not capture the whole picture. It is making assumptions such as that the user favours each of the tracks equally or has no order of importance for going on the Golden Record. Is the track chosen as the last of the 10 less favoured than the first choice? Or was it chosen as the user went through each track as systematically laid out on the YouTube channel?
Reference
Systems Innovation. (2015, April 19). Network connections. [Video]. Youtube.
Task 8: Golden Record Curation Assignment
I chose the following 10 tracks:
- “Melancholy Blues,” performed by Louis Armstrong and his Hot Seven. 3:05
- Holborne, Paueans, Galliards, Almains and Other Short Aeirs, “The Fairie Round,” performed by David Munrow and the Early Music Consort of London. 1:17
- China, ch’in, “Flowing Streams,” performed by Kuan P’ing-hu. 7:37
- Bach, “Gavotte en rondeaux” from the Partita No. 3 in E major for Violin, performed by Arthur Grumiaux. 2:55
- Senegal, percussion, recorded by Charles Duvelle. 2:08
- Beethoven, Fifth Symphony, First Movement, the Philharmonia Orchestra, Otto Klemperer, conductor. 7:20
- Japan, shakuhachi, “Tsuru No Sugomori” (“Crane’s Nest,”) performed by Goro Yamaguchi. 4:51
- Peru, wedding song, recorded by John Cohen. 0:38
- Bach, The Well-Tempered Clavier, Book 2, Prelude and Fugue in C, No.1. Glenn Gould, piano. 4:48
- “Johnny B. Goode,” written and performed by Chuck Berry. 2:38
These 10 tracks were chosen based on what I think represents the diversity and complexity of human culture and civilization the most. I tried to ensure sounds from various cultures were included to illustrate the multicultural world that we live in on planet Earth. Also, various styles (e.g. classic, jazz, vocal) were selected to showcase the sophistication and complexity that humans are capable of.