
In this post, I have created an Infograph on how people communicate during WWII. Please click on the file in order to view it along with references!
FA670A3E-8659-4C32-AD24-DD1BBC3294A1-merged
Below is the inserted URL for the Infograph. Enjoy!
In this post, I have created an Infograph on how people communicate during WWII. Please click on the file in order to view it along with references!
FA670A3E-8659-4C32-AD24-DD1BBC3294A1-merged
Below is the inserted URL for the Infograph. Enjoy!
Posted in Final Project
Speculative Future #1:
https://view.genial.ly/619423e950419a0d7f199cb3/interactive-image-speculative-future-1
In the year 2035, the crisis of overpopulation has take a greater toll on both the environment and society. Frequent shortages of food, shelter, and resources are making living conditions far worse than ever before with many families struggling to survive and succeed in this day of age. The World Health Organization (WHO) and United Nations (UN) had emergency meetings in order to figure out a solution that will reduce the issues of overpopulation across the globe. There were many ethical debates of sterilization, human nature, and the right to have a family. However, many knew of the dire situation that the globe was in. There was not enough resources for everyone to have the right to reproduce. It decision was either let the human population continue to do what they did and have Earth be inhabitable in the next few decades or find a harsh solution that will save Earth. There needed to be a drastic rule to ensure the survival of humanity and a better world for the future children. WHO and the UN came to a conclusion that all parties agreed with. Everyone in the world will be injected with a chip that contains all their personal data including: financial status, career, education, health, family history, political views, social media use, personality, and references. The information can be updated in real time through a central database that is tied to the government. Since the chip flows through the blood, it cannot be taken out once injected. This chip is also able to detect whether someone is pregnant or not by using the hormone levels as an indicator. Each government has created a new law where in order to produce a child, parent(s) will be required to apply for a permit. To apply for this permit, parent(s) will need to go online to their government site and apply. The government will use the data on their chip and put in into an algorithm that will decide whether to approve of the permit of not. The algorithm is trained to determine the likely hood of the child being successful and being a contributing member to society. If the chip detects that someone is pregnant without a permit, the chip is able to release medicine that will induce an abortion. If the initial medicine fails, there is a GPS tracker on the chip that will enable government entities to find the person(s) and perform a procedure.
Lucy was in high school when this law was implemented and knew from then she wanted a child. Now, in the year 2051, she is an adult who wants to have a child with her partner Brent. Lucy worked very hard to ensure that she increased the chance of the algorithm approving of her permit. She attended the best school in her area, has a well-paying job, a great genetic history, clean social media, and grew up in a good family. She volunteered for great causes and donated money whenever she could. She showcased her good deeds as much as possible in order to increase the chances of her good deeds being noticed. Brent is also the same. They worked very hard in order to increase their odds as they have some of their friends got denied a permit, even though they thought they were qualified to be parents. The process of waiting for the approval of the permit was stressful. The qualifications were never made clear. It appeared that it was entirely up to the AI to decide whether to approve or not. A few weeks go by and finally Lucy and Brent get a notification.
They were denied.
Lucy and Brent were devastated. They did everything that was “right.” What could be the possible reason for this decision? Was it their social media use? Was it their careers? Was it their race? The media told people that the AI was non bias in terms of race and sexual orientation. What could they do to improve the chance of approval in their next application? The main focus of the AI was to ensure the child will live in a supportive household and grow up to be a contributing member to society in a positive manner. With all this in mind, why were they denied?
Speculative Future #2
https://view.genial.ly/619426abc5d9760d8b0e9fe0/interactive-image-speculative-future-2
In the year 2020 due to the Covid pandemic, online and hybrid learning was taking off across the board. Teachers noticed that those students who use to not excel in face-to-face (F2F) learning were excelling, while some students who excelled before were now struggling. There was another group of students who still had the same performance level in either mode. Researchers were researching on this phenomenon and started to look into the characteristics of what makes one excel in online learning versus F2F. What is the difference in personality traits and learning styles? What factors affected this?
With the popularity of online learning, researchers, educators, and the government worked together to train an AI to decide what mode of learning students should be taking starting from the beginning of high school. Three options were provided for students: online, hybrid, and F2F. All involved entities decided to train the AI using data points such as: grades, students behaviour, IEP’s, personality, work ethic, learning goals, and teacher comments. With these data points, the AI will determine which mode of learning the student will be in for the year. Each year, the AI will use new intel to determine whether the student will stick with their past mode or be switched to a new one. The goal of this to maximize learning potential in a student. This would likely help governments cater resources to the needed areas. Those who needs more help would get more through F2F, while those who were more independent would be able to achieve more independence in online/hybrid modes.
It’s the year 2042, and Isabella is just starting high school. She has heard about how the pandemic changed how students received their education. She was hopeful that she would start the new school year learning F2F. She enjoyed how elementary school was taught and loved the interactions with her peers and teacher. Two weeks before the start of school, she was notified of her results. It was determined that she would be starting her first year of high school online. Isabella was not very happy with the results as she felt that the AI failed to consider her social personality. All her friends got F2F, which meant that she would not be with them for the school year. However, she had no choice but to follow through with it. Though initially she hated the thought of not attending class in person, by the end of the first term, she was happy with progress. She was achieving her learning goals and performing well! She was able to make friends online and developed a strong friendship with them. They would meet up with each other whenever they could. With her first year of high school done, the AI used the new data to access students again. Two weeks before her second year of high school, Isabella got her results… F2F. She was shocked as to the change in mode of learning. Her performance was the same as before high school, so why did she have to attend F2F? The new friends she made had a mix of hybrid and online. However, she did not want to judge her results as she had a good experience with her previous one even though she was sceptical at first. With an open mind, Isabella started the new school year F2F. As it turns out, the AI was once again, correct in the decision made. Isabella began to question whether the AI knew her better than she knew herself. She honestly thought that she would know herself more, but clearly not. Is the AI collecting more data than what is being told to them? Is the government not being transparent? Or has the AI received enough data from various data sources that it is almost fool proof? Whatever it may be, it is clear to Isabella that something was being done right.
Posted in Weekly Tasks
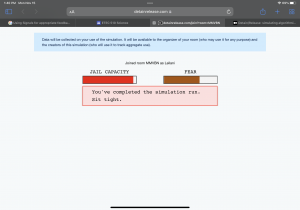
The first thing I noticed was how the algorithms labelled each person. Those who I thought had committed crimes that were not as “bad” were the ones that fled. My criteria for releasing suspects was that if their crime did not correlate with direct bodily harm to another person or if they had a medium to low risk of violence. However, this proved to not be the best case. There were many suspects that fled when I released them, hence my higher fear bar. There was also one rape charge where I released the suspect because the algorithm determined that they were low risk for all 3 categories (though for me rape was a heft crime). However, this turned out to be wrong as the suspect did not show up for the hearing.
I had to slightly change my criteria for detaining/releasing people as my fear metre went up. I became more “trigger” happy after I had multiple suspect commit more crimes or not show for the court date. This added pressure required me to detain more and more people as time went on for crimes that I thought were not as severe. I also noticed that the AI generally had higher risk ratings for those who were Black/Hispanic versus White. Also, the trend between most of the suspects is that they are in poverty/cannot afford to loose their job/income/healthcare. Only a few suspects had stated concern over their family/personal life. Majority were financial reasons. O’Neil (2017) mentions that algorithms target those specifically in poverty. Because of this, minorities are targeted relentlessly for the position they are in, largely due to historical factors that they are unable to get out of. Trusting AI to determine risks is not the way to go. AI get trained based on who and what information was provided to them. Afterwards, AI’s can train themselves based on what they have learned. If this is done, the AI will have accumulated biases based on the biases in society. If communities and governments truly care about crime, targeting the issues that bring poverty is the key to reducing crimes. If people were living an overall satisfying life where they can afford the basic necessities without issues and have healthcare covered, there is less reason to commit crimes.
Posted in Weekly Tasks
When trying to complete this task, the biggest thing I noticed is how difficult they make it for you to move onto the next page. I spent way more time than I expected to fill out questions and provide simple information (especially the “I am not a robot” part). The overall format of the site was counterintuitive. The next button is on the left (instead of the right), they asked reverse questions, made it difficult to close any pop ups or tabs, and made pop ups reappear frequently. All the functions (eg. Speed of pop up disappearing, how frequent pop up reappears, bad design, hard to find buttons) forced me to spend more time on the site. Based on this weeks module, a platform will likely do this to ensure that you stay on the site as long as possible so that they can gather more data on your actions (which can later be used by others or sold off). This makes me think about the design of a platform. For me personally, if a site has too many pop ups and is difficult to deal with, I will not use the site and will quickly close it. However, in this case, I needed to use this site, which is why I tolerated the pop ups and design of it. This made me realize that much of the data collection has to be done behind the scenes so that consumers do not need to deal with the constant disruptions in using the platform. This realization is what makes it concerning. If I enjoy the site, I will spend more time on it. If the site/platform has algorithms that work behind the scenes to capture my data, the better the design of the site, the more data they can collect. Just like the TedTalks mentioned, there is some good in it, but there can be consequences that are detrimental (eg. Government invading citizens privacy, addictions, marketing etc).
For the first part, the thing I struggled with was creating a password that met all the criteria’s that it listed. I even had to search up what Cyrillic character was because I never heard of it before. Also, the help tab kept getting in the way (I like my screen to be free of any pop ups) so I kept clicking on it to go down. But it went down slowly throughout the whole time. Furthermore, I noticed that the “cookie” pop up wouldn’t allow me to click “Yes.” I had to click “not really no” for it to dissappear. It never gave me an option. Additionally, the “I do not accept the terms” were counterintuitive to what I am use to. I had to unclick it to “accept” the terms.
On the second page, I had to create a profile. They made this difficult to fill out since the age scroll tab had to match your birthday. It was hard to locate the correct placement of the age and led to frustrations (and more time spent trying to find the correct number). Also, when picking the country, they used flags instead in black and white and closely spaced together, which means that it would take a longer time for me to find the correct country. I also struggled with the gender tab. Usually, when something is highlighted (in this case blue), that is the choice you picked. In this case, it was the white colour that indicated your chosen gender.
For the third page, I initially started to deselect all the ones to start from scratch in order to pick 3 choices. However, I noticed in the last column, there was the option to select or unselect all. Because of this formatting, I spent more time on this page than necessary. Since English speakers/learners read from left to right, or up/down a column, they used this knowledge to ensure that I would not see select/unselect all option until much later.
The last page was what fustrurated me the most. For the words, they picked words (eg. Glasses, circles, light, bow) that had multiple meanings depending on context and what they want. The pictures they showed for each word essentially fit the critieria that they laid out. However, I did not know if I was picking the right now. I had to keep repeating the same things over and over again for what seemed like 5-7 minutes before I was able to complete it. Going back and forth between the same words made me question my interpretation and I would switch my selections for the pictures every so often. This made me spend a lot more time on the site.
Posted in Weekly Tasks
Derek had a very different reasoning for curating his list of 10 songs. He picked with singing (voices) in it. He also mentioned that there were 11 singing songs, so he narrowed it down to 10 based on different languages/cultural backgrounds. For me, I picked songs based on different cultural backgrounds and genres. It is interesting to note that people appear to have different criteria’s. I wonder if this is because of personal thoughts, cultural backgrounds, or some other reason? What makes one person categorize things differently than another (if left to their own accord)?
He mentioned that human voice is unique and that is similar to what I said. However, instead of focusing on human voice, I focused more on culture and how the same species has so much variation.
Both of us touched up on wanting to show variation in different cultures and not wanting to repeat songs from similar cultural backgrounds. Derek brings up a good point that his list is more Euro-centric, which is something I also noticed when looking at the Golden Record. I think its very important that we noticed it and try our best to showcase various cultures because there is such a wide range of them on Earth.
Posted in Linking Assingments
When you first look at the visualizations, there are large amounts of nodes and edges that make it difficult to see all the links between nodes (participants) and the music pieces that they chose. When you chose a community, this “cleans” up the data a bit and makes it easier to visually see the links between nodes. The big thing I noticed is that the generation of communities by the software is based on the similar music choices made by each node (person). However, the visualization doesn’t capture the reasons behind the choices made by each node. It only shows that there is a link between each node and the music choice. It doesn’t show why the link was made between each node (eg. Personal choice, genre, instruments, beat etc). Hence, there is a lot of information missing from this graph. We would need the raw data and the posts made by each person in order to capture the reasons behind their choices. We can only infer why the responses are similar, but without the raw data, we cannot truly know. A graph doesn’t show all the data points and the reasons behind the responses.
One thing I noticed is that this graph is not a weighted graph. Instead, I would categorize it as something that is more closely related to unidirectional graph (every though there are no arrows). Each link within a community “points” from a person (node) to a music piece (the other node). I say its unidirectional because the music piece didn’t choose the person, the person choice the music piece.
The biggest takeaway I had from the statistic courses I took was how easily data is manipulated. It is very to change parameters so that you get a certain conclusion from the data that fits with what you are looking for. Algorithms are affected by the biases of people that create them and train them. The way someone gathers data, the types of questions, things that one omits, includes, or assumes, and types of programs used all affect what the graph/data shows. This makes it very easy to manipulate and cater your data to an objective. We often seen stat headlines (eg. 60% of people agree that pineapple shouldn’t be on pizza) that only includes the conclusion. Unless we get to read on method and procedures of the study and the raw data, there could be tons of reasons that the conclusion was made. In the pineapple on pizza example, it is possible that the type of questions asked forced people to answer the question or pick a “side.” The program used could have also analyzed data so that a certain outcome was achieved. This can group people in certain ways and either empower them or divide them.
In a political context, this type of “community” forming algorithm can have positive and/or negative impacts. If we look at the issues of conspiracy theories/anti-vaxx/misinformation spreading, it because of how the algorithm works. Just like how this program which the curated music lists connected people and made communities, people who have certain searches will have websites/groups shown to them who have similar searches (like the Google algorithm using Spider). This can lead to confirmation bias and spread of misinformation when you have groups of people validating each other’s thoughts. The algorithm is trained to provide information and data based on what other people before have searched and clicked on. All the hyperlinks that are connected to a page is what the algorithm uses to showcase potential things a person wants to see. On the other hand, finding communities that empower and help others is very beneficial. There are tons of online platforms that cater to people looking for certain things. Of course, this is assuming everyone has an agenda and is trying to manipulate things to suit their interest. While there are tons of people that do that, there are also tons of other people who are just trying to find answers and avoid as much bias as possible.
In terms of “null” data points, unless the data is being included in the graph, I don’t see it being reflected in the data. The limitation of the internet, algorithm, and search engines is that they are unable to make changes without actual data points given. They can’t reflect on things without having data given to them. It is possible for them to use the data given to them to infer possible reasons, but unless concrete data is given, telling them “these are the reasons,” it will be hard to accurately interpret. That is why it is important to have data sets/points that show the reasons why something was chosen and why something wasn’t chosen. This allows for a full picture of the graph.
Posted in Weekly Tasks