
“The power of the Network theory is really in its high degree of abstraction” (Code.org., 2017).
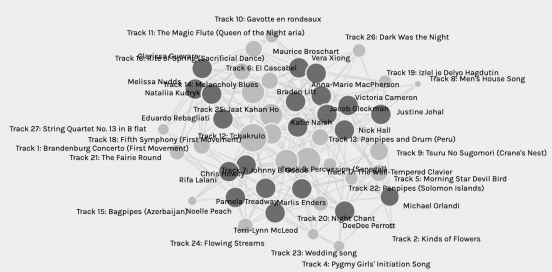
According to Graph theory, “all of the nodes have static properties that we can quantify” (Code.org., 2017). Since all the students in our class have been asked to select only 10 music compositions out of 20, it can be argued that those that each of us has chosen have been given a value of 1 and those left out worth 0. Given that the students in this class are (black) nods in the graph as well, one can notice which music compositions they have chosen by looking at the edges that are coming out of their own nodes. Knowing that algorithms take the weights to infer what our likes and preferences are, it can easily be interpreted from the graph above which music compositions are more favourable among us. According to Graph theory, “the higher degree of connectivity, the more likely one can hear the piece of gossip you are spreading” (Code.org., 2017). By looking at the gray nods that represent the music compositions, it is evident that some of them are smaller and have less degree of connectivity, while others are quite big and hence have a higher degree of connectivity and a greater chance to be heard of. Because we have all been asked to use specific criteria to select these music pieces, it can be argued that we have “liked” them for a similar reason and although predictability is still a challenge for big corporations such as Facebook and Google, the data collected for this assignment can definitely assist the instructors of this course in delivering a tailored message to groups of people based on their interests.
It is, of course, challenging to analyze such a graph as a lot of the information is still missing (everyone’s specific criteria for selecting music, demographics, etc.). Many of the statements that can be made about this graph will most likely be based on assumptions, misinterpretations, or perhaps even biases. Can we analyze those?
The researchers at the University of Washington, University of Virginia, Harvard University, and Yale University are currently working on the Project Implicit which reveals people’s potential biases based on their test responses. Although they do not guarantee anything or make any claims for the validity of such results, the data they collect oftentimes reveals the results people are not ready to hear. The researchers are using the Implicit Association Test, which is somewhat similar to the Graph theory. It measures the association between concepts (man/woman, gay/straight, white/black) and evaluations (good/bad) or stereotypes (fit, clumsy, etc.) Although it is not perfect and has not reached its degree of predictability yet either, it does provide the researchers with a huge database to analyze, interpret, and make conclusions. So when we analyze this graph and how a certain group of people has chosen the same music compositions for this assignment, we can look at this from the unconscious biases perspective.
This assignment has also reminded me of the politics in regard to elections. By leaving comments online, linking posts and pages that speak on a particular topic, people are providing data about their likes that can be interpreted and analyzed by algorithms. The groups of people are being formed based on such common likes and can be manipulated by those who have access to such data on them. The new Netflix documentary “The Social Dilemma” and Albert Bandura’s social-cognitive theory reveal a lot of eye-opening information related to this topic. I believe that this is how our current Ukrainian president, Volodymyr Zelensky, a former TV comedian, has won the elections. Prior to the elections, he launched a TV show that has been broadcast every day on national television for a year. In the show, he plays the role of a teacher who decides to run for president but loses and the nation suffers because of that. By washing the brains of the Ukrainians for 2 years, conditioning them to believe that if they do not vote for him they will suffer, similar to Bandura’s Bodo Doll Experiment, he was able to manipulate a large group of people and get the desired result. This proves that having a lot of data on people is powerful but can also be dangerous.
References:
Code.org. (2017, June 13). The Internet: How Search Works . Retrieved from https://youtu.be/LVV_93mBfSU