GeoDASH: Exploring Predictive Policing Technology

As someone living in Vancouver for the past 9 years, the first thing I did when I saw the map was zoom into my neighborhood to see what has been happening in my surrounding areas. In addition, I also looked around the locations that I frequent.

After tinkering with the map, I decided to look read the GeoDASH FAQ page for more details on how the data was collected and visualized on the map. Overall, due to the sensitive nature and need to protect the privacy of those involved in the incidents, it seems like most of the information displayed can only be considered as proxy measures, as most of the actual locations have been rounded to the approximate block level.

With the lack of transparency in terms of how information is being collected, reported, and mapped, it is rather challenging to assess the validity of information presented on GeoDASH at face value without cross-referencing other sources, to gain a more comprehensive understanding of the crime trends in different neighborhoods.

Some inherent biases that may appear when interpreting the data on the map are intersectional in nature— using GeoDASH without additional understanding of geographic, socioeconomic, and demographic characteristics of Vancouver may result in misinterpretation of crime trends.

For example, geographically speaking, certain areas may have higher concentrations of crime due to population density, land-use patterns, or proximity to transportation hubs (e.g. central business districts of Downtown Vancouver area vs suburban residential area in Langely)

From a socioeconomic perspective, areas with higher socioeconomic status may have greater resources for crime prevention measures leading to more reported crimes (e.g. West Vancouver), compared to more disadvantaged neighborhoods where crime may be more prevalent but underreported (e.g. Downtown Eastside).

Vancouver being a diverse city with pockets of immigrant cultural hubs and communities, differences in law enforcement practices targeting specific demographic groups can also result in skewed representations of crime patterns and disparities of enforcement outcomes.

To conclude, interpreting GeoDASH information as someone not from Vancouver might be challenging at face value,  as there is a lack of nuanced understanding of the makeup of this city, which requires a lot of contexts to provide a more holistic and accurate interpretation of the presented data. Even for a Vancouverite, the historical background can be an insightful starting point to gain a better understanding of the city that I live in.

Learning Analytics Adventure: Factors that Impact Student Motivation and Completion of MOOCs

Abstract

Due to the massive number of potentially enrolled students, the open-access nature for learners to participate or not participate, and lack of physical space on online platforms,  massive open online courses (MOOCs) embody a particular learning experience independent of time and space (İnan & Ebner, 2020). With the heterogeneity of learners with varying learning motivations, this impacts whether or not learners complete the course. By identifying the characteristics that matter to learners, the learning experience of MOOCs can be improved and prioritized accordingly (Nanda et. al, 2021).

Based on the Exit Survey questions of edX-based UBC MOOC on Climate Change, two open-ended post-course survey questions were analyzed. A frequency analysis was conducted and visualized as a word cloud with learning analytic tool AntConc, revealing that learners found the video content most helpful, whereas the assignments, lack of flexibility in time and deadlines, and unguided peer evaluation were aspects that negatively impacted their learning experience.

Statement Question and Literature Review

Based on Nanda et. al’s (2021) study on analysis of open-ended feedback from MOOC learners, due to the heterogeneity of learners that enroll in MOOCs, it is important to identify the characteristics that are most important to the different learners and to prioritize them accordingly based on qualitative post-course surveys. In their study, they conducted latent Dirichlet allocation (LDA) topic model on 150000 MOOC learners from 810 MOOCs in different subject areas with the following three open-ended questions:

Q1) What was your most favorite part of the course and why?

Q2) What was your least favorite part of the course and why?

Q3) How could the course be improved?

From their qualitative analysis, the researchers identified characteristics that impacted learner’s experience in completion of the MOOCs: the quality of course content, accurate description of prerequisites and required time commitment in course syllabus, quality of assessment and feedback, meaningful interaction with peers/instructors, engaging instructor and videos, accessibility of learning materials and usability of the platforms.

Based on these studies, I would like to conduct a similar review on the edx-based UBC MOOC course on climate change, provide some data visualization and generate some discussion for further development of collection of data, and improvement of the course for future iterations.

Methods and Tools

For the scope of this project, I hope to center exploratory qualitative analysis from the Exit Survey as a starting point to further investigate learner data surrounding student demographics,engagement in course content, engagement with their peers within the course to extrapolate beneficial information and gain some insight as to what are the characteristics and aspects of the course that contribute to learner’s motivation to complete or drop out of the course.

First I familiarized myself with the quantitative and qualitative data from the MOOC, and operationally defined some of the different themes of student behavior and data that I wanted to investigate, namely student motivation, student familiarity (to subject matter), student identity/demographics, student engagement (broken down to four categories) and qualitative feedback.

Table of Themes
Motivation
Climate Entry Survey –       Q2.1 What are the main reasons for taking the course?

–       Q3.1 How many weeks do you plan to engage in the course?

–       Q3.2 How many hours per week on average do you plan to spend on this course?

–       Q3.3 How frequently do you plan to use course components?

–       Q4.2 How many MOOCs have you participated at least partially?

–       Q4.3 Think about the MOOC you were most engaged in, what best describes the level of engagement?


Climate Exit Survey


–       Q2.1 Were your goals for taking the course met?

–       Q2.2 Are you likely to…

–       Q3.1 How frequently did you use each of the course components?

–       Q3.3 How many hours per week did you spend in this course?

–       Q3.4 What interactions did you have with course peers?

–       Q4.1 Which of the following components of the course were you very satisfied with?

–       Q4.2 How did you find the following modules?


Familiarity (to Subject Matter)
Climate Entry Survey


–       Q.1.1 ~ Q1.3 Climate Knowledge

–       Q4.1 Prior to this course, how familiar were you with the subject matter?

Climate Exit Survey –       Q.1.1 ~1.3 Climate Knowledge
Student Identity/Demographics
Climate Entry Survey


–       Q5.1 Which country were you born in?

–       Q5.2 Which country do you currently reside in?

–       Q5.3 Main languages you speak

–       Q5.4 English proficiency

Student Engagement
Person_course_day_cleaned.tsv General (time spent)

–       Avg_dt

–       Sdv_dt

–       Sum_dt

Video Engagement:

–       Nevents

–       Nplayvideo

–       Ntranscript

–       Nvideos_viewed

–       Nvideos_watched_sec

Forum Engagement

–       Nforum_reads

–       Nforum_posts

–       Nforum_threads

–       Nforum_endorsed

–       Nforum_threads

–       Nforum_comments

Problems

–       Nproblems_attemped

–       Nproblems_answered

Qualitative Feedback
Climate Exit Survey

–       Q2.3 What did you like most about the course?

–       Q2.4 What did you like least about the course?

Qualitative Feedback Analysis


I utilized text analysis software AntConc for frequency analysis and visualization via the word cloud function, as it would be the best way to understand the top 50 most frequent words from the text at a glance.

There were 200 responses for the “What did you like most about the course” question, and 216 responses for the “What did you like least about the course” question. To prepare the text for frequency analysis. Due to the smaller scope and sample size, I manually cleaned up the comments by normalizing to consistent lowercase, removing unicode characters and punctuation, removing common stop words, and then proceeded to stemming and lemmatization.

Findings

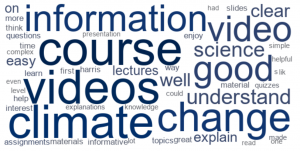
In the question “What did you like most about the course?”, below are some notable words that stood out.

61 students reflected that the “videos” were helpful to understand the course content. Alongside the word cloud with higher frequency are words with positive sentiment such as “good”, “clear”, “understand” and “well”.

On the other hand, in the question “What did you like least about the course”, below are some notable words that stood out in the word cloud.

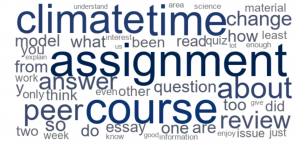
In the word cloud, the words “assignment”, “time” and “peer review” were some that I would like to mention. Having gone back and read the comments in detail, I found that they were somewhat related to each other. Many of the students reflected that they struggled with the assignments due to deadlines and personal time constraints, in addition to the peer review component that was required for completion of the assignment.

From the comments on assignments, 4 students shared that they came into the course with less background knowledge on the subject matter of climate change, feeling overwhelmed with the assignment and found “having to write essays on climate science before establishing a knowledge base was more than a little daunting.” There were also comments on how the assignments were rather demanding due to deadlines and personal time constraints, and would prefer “shorter or optional assignments” rather than the current structure.

Lastly, the assignment had a peer review component, in which 18 students voiced their dislike due to various reasons. Some students stated that “the rubrics for peer reviews were limiting and not quite matching the assignment” and had no guidance on how to provide constructive peer feedback, with varying degrees of effort put into peer evaluation such that many were in agreement that perhaps “it is necessary for staff review”.

Discussion and Future Development

One main limitation of this exploratory analysis of the qualitative analysis is only being able to conduct it after the course has ended and the surveys have been taken, and not in real-time as the course was in progress.

Aligning with Eriksson et. al’s (2017) identified three main factors influencing MOOC dropouts, which included mismatch between learner’s perception and actual course content and design; learner’s ability to manage time; and social aspects of learner community feeling.

Based on the findings of the frequency analysis as a starting point, I hope to discuss further potential investigation of data for further improvement and development of the MOOC course for future iterations based on some of the themes from the course survey comments.

Course Component, Learning Materials and Resources

Besides the positive sentiment towards utilization of videos in course delivery, I think it would be interesting to look further into the general utilization of course components, learning materials and resources. Based on the self-reported utilization of course components in the entry and exit survey, in comparison to the actual generated data of course component utilization, it would be valuable to investigate the difference to identify student expectations of what resources they think they will use versus the actual utilization of available resources, and whether there needs to be more development of certain materials for future iterations of the MOOC.

Peer Interactions and Peer Evaluations

In continuation of the findings for the negative aspects of the course, I think it would also be useful to look into the self-reported interaction with peers, and the actual generated data of peer interactions. With the utilization of Social Network Analysis, utilization of NodeXL for peer interactions can provide more insight on the socio-constructivist potential of MOOCs, Building rapport with the peers might also ease part of the negative comments on peer reviews, in addition to providing clearer rubric and guidelines for providing peer reviews, as  “peer assessment techniques and exploiting peer support can revolutionize emergence of new pedagogical models in the MOOC approaches” (Yuan, Powell & Cetis, 2013).

Prior Experience with MOOCs and Time Management

In terms of students reflecting that there was lack of flexibility and deadlines, in addition to their personal time management and constraints, I believe Time Management should be a theme that I would further add to the Table of Themes. Some of the relevant questions that would help operational define this theme currently overlap with those in the Entry Survey for Motivation, and additional questions, such as whether or not they have full-time/part-time occupations, can be a proxy measure to how much time students may realistically have.

However, I believe some of these questions also overlap with another potential theme, namely Familiarity (with MOOCs) in terms of whether or not students have had previous pedagogical experience with MOOCs, assuming that those with previous experiences have a better idea on delegation of time and other metacognitive executive functioning. Having additional survey questions that target these themes might provide more points of data collection for generating a more well-rounded idea of the students motivations and capabilities.

Personal Reflection

One big challenge that I was faced with was learning to familiarize myself with the massive quantities of data that was generated from the MOOC course, and figure out ways to operationalize it in order to target what I wanted to investigate.

Another major challenge was the learning curve to learn how to use the different Learning Analytic Tools that were available. For Tableau, I had to go through their tutorial videos to understand how to input the data with each other to create the visualizations that I wanted. For AntConc, the tool itself was more straightforward due to the smaller scope of functions and settings, however, learning to format and prepare the comments for analysis was something new that I learned about. The dataset was manageable in terms of manually preparing for it, though should the scope increase, proper Python programming would be beneficial to complete the task. In retrospect, I believe NodeXL might have been a more robust text-analysis and social network analysis software to utilize for this project. Ideally, I would have liked to have more time to understand the data and the functions of the application to create more substantial visualizations that could provide more insight to the social interactions of students in the courses, especially when it comes to the socio-constructivist potential of crowdsourcing peer reviews and evaluation in MOOCs.

References and Literature

İnan, E., Ebner, M. (2020). Learning Analytics and MOOCs. In: Zaphiris, P., Ioannou, A. (eds) Learning and Collaboration Technologies. Designing, Developing and Deploying Learning Experiences. HCII 2020. Lecture Notes in Computer Science(), vol 12205. Springer, Cham. https://doi.org/10.1007/978-3-030-50513-4_18

Eriksson, T., Adawi, T., & Stöhr, C. (2017). “Time is the bottleneck”: A qualitative study exploring why learners drop out of MOOCs. Journal of Computing in Higher Education, 29(1), 133-146. https://doi.org/10.1007/s12528-016-9127-8

Khalil, Mohammad & Ebner, Martin. (2017). Driving Student Motivation in MOOCs through a Conceptual Activity-Motivation Framework. Zeitschrift für Hochschulentwicklung. 12. 101-122. 10.3217/zfhe-12-01/06.

Nanda, G., A. Douglas, K., R. Waller, D., E. Merzdorf, H., & Goldwasser, D. (2021). Analyzing large collections of open-ended feedback from MOOC learners using LDA topic modeling and qualitative analysis. IEEE Transactions on Learning Technologies, 14(2), 146-160. https://doi.org/10.1109/TLT.2021.3064798

Nawrot, I., & Doucet, A. (2014). Building engagement for MOOC students: Introducing support for time management on online learning platforms. Paper presented at the 1077-1082. https://doi.org/10.1145/2567948.2580054

Zhu, M., Sari, A.R. & Lee, M.M. Trends and Issues in MOOC Learning Analytics Empirical Research: A Systematic Literature Review (2011–2021). Educ Inf Technol 27, 10135–10160 (2022). https://doi.org/10.1007/s10639-022-11031-6

Evaluation of Learning Analytics Tool

Evaluation Tool and Motivation

For this assignment, I have decided to choose OnTask as the learning analytics tool of choice for analysis. I want to look into the ways that this tool goes above and beyond monitoring student behavior patterns for “early alert” by providing real-time feedback for students and suggestions for further improvement by recommending additional resources for reference. In addition, as it is not limited to one LMS system, it is a potentially useful add-on for a variety of contexts. I hope to reflect on the ways that this tool would be especially helpful in the context of the UBC OnTask Pilot Study for first-year physics course as an example.

I chose to utilize the Cooper Framework (Cooper, 2012)  as the guide to evaluate this learning analytics tool, as it takes on a more “descriptive, rather definitive approach which allows to deal with real-world complexity of how analytics is” (p.3). I believe this framework refers to “characteristics of learning analytic tools which may overlap and are assumed to be extensible and adaptable” (p. 3), which I believe is important when it comes to benefiting from the affordances of the tools, while thinking about best practices for utilization in different educational contexts.

OnTask Tool Functions (OnTask, n.a)

OnTask Project “aims to improve the academic experience of students through the delivery of timely, personalized and actionable student feedback throughout their participation in a course”. Some core functions of OnTask include:

  • Assessment of data about student activities throughout the semester and allows instructor to design personalized feedback with suggestions about learning strategies for students to adjust their learning progressively
  • LMS- agnostic and receives data from various sources (i.e. online engagement, assessments, student information systems, electronic textbooks, discussion forums,etc.)
  • Directs students to specific chapters/examples in textbooks, suggest additional readings/resources, enroll in required workshops/tutorials/labs, redirects to university support services

Cooper’s Framework – UBC OnTask Pilot Study

Based on UBC’s OnTask Pilot Project (Moosvi, 2019), the tool was used in first-year physics course PHYS1117 by instructor Simon Bates and co-instructor Mateus Fandino to engage with students more and add personalized feedback for each student based on their performance throughout the weeks. Using Cooper’s proposed framework (Cooper, 2012), I have analyzed this case study as below:

Analysis subjects, objects, and clients Analysis Subjects: first-year students in PHYS1117


Analysis Objects: first-year students in PHYS1117, specifically student performance within the course


Analysis Clients: course instructors

Data Origin ●     Data collected from LMS system Canvas (i.e. assignments, exams and assessments, student engagement data, etc.)


●     In-class attendance and participation


●     Laboratory sections

Orientation and Objectives Orientation:

Diagnostic in nature even though the pilot project is an exploratory one, as it aims to investigate whether personalized feedback can  improve student performance.


This study is also a reflective orientation, although the natural extension of the pilot project could be used to predict outcomes of future cohorts, in which a more diagnostic mode is expected.


Objective: to enhance student performance and outcomes based on mix of quantitative and qualitative measures

Technical Approach Assumption of technical approach being statistical and hypothesis testing in nature based on analysis of students’ previous course performance without personalized feedback from OnTask compared to students’ course performance with the personalized feedback from OnTask.
Embedded Theories Socio-constructivist approaches for students to co-construct their learning process via receiving and implementing feedback given by instructors


Based on some of the feedback from students, there was a general positive perception from students for utilizing OnTask to provide feedback on what to focus on readings, reminders for upcoming assessments and deadlines, areas of confusion and commonly made mistakes, reflection of previous and future coursework, as well as helping students gauge their own progress in the course. There was also an increase of student engagement and interaction overall due to the weekly personalized newsletters that the instructors sent out.

Reflection

The pilot study results are in alignment with the findings of Pardo et. al (2019) on a first-year undergraduate engineering course. Although the size effect of personalized feedback was not large on the midterm scores, the result still provided a significant and positive impact on student satisfaction with feedback and academic performance in the midterm exam (p. 136). The researchers associated the feedback as an important factor to support student success, and highlighted the need to establish a connection between student data and how to utilize it to provide high quality feedback. Suggestions on creating comment templates to tailor to a course, or for algorithms to match between comments and observed data were provided.

Some further research on better techniques to identify individual differences in student participation in learning experiences and students study habits were highlighted, as these missing pieces of information could potentially provide additional information for interventions with potentially high effects.

In terms of applying it to my personal context of foreign language teaching and learning, due to the smaller scale of students per class and the increased amount of qualitative assessments, there might not be as big of a difference between utilizing OnTask versus the instructor providing feedback directly. However, I still believe OnTask could be a great tool to identify common challenges that students might be facing based on their qualitative assignments, and can still provide insight on student performance in courses regardless.

References

Cooper, A. (2012) CETIS Analytics Series Volume 1, No 7; A Framework of Characteristics for Analytics http://publications.cetis.ac.uk/2012/524

Lim, L., Gentili, S., Pardo, A., Dawson, S., & Gašević, D. (2018). Combining technology and human intelligence to provide feedback and learning support using OnTask . In Companion Proceedings of the 8th International Conference on Learning Analytics & Knowledge (LAK’18), Sydney, Australia. Academia.

Moosvi, Firas (2019, June 20). Learning Analytics Project OnTask: A Case Study https://learninganalytics.ubc.ca/ontask-a-case-study/

OnTask (n.a.). https://www.ontasklearning.org/

Pardo, A., Jovanovic, J., Dawson, S., Gašević, D., & Mirriahi, N. (2017). Using learning analytics to scale the provision of personalised feedback. British Journal of Educational Technology, doi:10.1111/bjet.12592


ETEC511 Final Project Retrospective

Project Design and Development

This project was something rather novel working in the realm of augmented reality, as I did not have a lot of previous experience with utilizing this kind of technology, especially in conjunction with language learning, which I am passionate about. It was fun to challenge myself in this way.

In terms of the design process, I think the literature review and supporting theories could be more thorough, as I would like to have the chance to dig deeper into existing research; put more thought in creating more robust scaffolded levels for language learners; and create supplemental potential user surveys to flesh out the usability testing.

As an example:
We changed our original idea of creating scaffolding levels based on the decreasing percentage of home language labels to increased delays in when the language labels will show up. This decision was made later in our design development, and though I think it is a better idea, I wished we had more background research to back it up.

If we had more time, I would like to develop the mock-up of our software a little more to create a more realistic demo of what could be achieved with the MyWebAR tools, to illustrate our concept and make it feel more grounded, concrete and feasible.

Collaboration and Teamwork

Bella, Jamie and Jennifer provided a lot of interesting observations from their hands-on experience working with elementary students in a classroom setting.  From their teacher’s perspective and the observations they provided, we quickly identified an existing problem that new immigrant students were struggling with. This reminded me of my own experiences trying to integrate into new classroom environments with a complete language barrier when I was younger.

Though I do not work with students directly, I was able to provide some of the design-thinking to the project from my experiences in research as well as creating learning content for language instructors, and contributed to the project in a different way.

All four of us worked collectively on the project proposal, report and slides.
Jamie took on the main responsibility for creating the AR demo in MyWebAR. Though the tool claimed to be rather easy for beginners to create AR elements, it seemed like it was also rather limited in what it could actually do. Jamie did a great job of creating an alternative user interface that demonstrated what we needed it to do.

I think one of the main challenges was finding time to work collaboratively together, as Jennifer was in a drastically different time zone. Sometimes Bella, Jamie and I we would block off time and work together on the project together, which I personally found super helpful.

Moving forward, one project management skill I would like to develop is creating clearer project objectives with actionable items and deadlines to ensure that we all know what needs to be done within what timeframe. I believe this will help drastically with group projects in the future.

Final Project- MySupport App (Helena and Sophy)

Our MySupport App is a centralized communication platform for support workers that assist students in special education.

Check out our website here: MySupport Website

Final Project Proposal – “MySupport” Database Web-Platform (Helena and Sophy)

Project Overview: MySupport

Our goal is to offer a digital centralized health management platform for special education students. Oftentimes, special education students have a large support network that can include a multitude of personal support workers (PSW) and individuals. For example, special education students can have school teachers, external tutors, speech therapists, physical therapists, and more depending on their needs.

Through our experiences working the public health system (Helena) and working with youths on the autism spectrum (Sophy), we realized there lacked an accessible and centralized platform for parents and PSWs to communicate and collaborate with each other.

Our platform serves to create a centralized space where all the support workers can input data, information, and clinical notes about the child’s progress for the parents and all the other PSWs to access. 

Challenges MySupport Tackles

    • Parents are overburdened with administrative tasks
      Students with special needs or extra support often need a large and expansive support network. Oftentimes, communication between PSWs is limited and parents need to devote a lot of time and energy to reiterating, organizing, and archiving information about their special needs child. Parents struggle with updating new PSWs and they are usually left with the task of ensuring that new PSW are given the information needed to appropriately support their child. Parents, who require more support to begin with, then are tasked with administrative duties that take time away from their ability to better care for their child and family.
    • Information is not centralized between PSWs
      Currently, information about special education students is not centralized in one place. The challenges this presents is that, they don’t have access to the information and progress that is being made by other PSWs that could better inform their practice and give the student the best support possible. An example being, that a student’s teacher could better help the student in the classroom if they are aware of the progress being made with the tutors or the speech therapist.Oftentimes, there can be a huge turnover rate of certain PSWs members on the team (e.g. tutors, educational assistants, etc.) such that it takes extra time and effort onboarding someone new. Having a centralized communication platform with information of the child available can streamline the process, and hopefully help with building rapport quickly between the child and new team members. An example being that with the profile and additional information available on the platform, the new member can have a better idea of how the child is motivated, their preferred ways of communication, and any additional behavior that PSWs should know such that they can build a connection to support their needs.
    • There is a limited ability to extrapolate data
      The disconnection between all the progress being made by each support worker also means there is no easy way to collectively track the child’s progress and attain real ent and important data. Oftentimes, there is no way for the parents or the PWS to collectively assess the child’s behavior and recognize patterns or changes. In addition, having context specific records of behavior patterns that pop up can also help the team understand what needs to be done to provide the right support.

MySupport Solutions

MySupport seeks to make the lives of parents and families easier by removing the burden of tracking and organizing feedback and progress between PSWs. Parents, especially in blended or divorced families where guardians are not always together to support the child may benefit from centralized communication. Further, with children that require a high level of support, extended family like grandparents might also be involved. MySupport allows all relevant parties caring for the child to stay updated and aware of their development. Effectively, the platform streamlines communication across all stakeholders and removes the possibility that information will be forgotten, lost, or missed.

Demographic and Target Audience 

  • Guardians of Special Education Children
    Parents of special education children could use this platform as a means of centralizing communication and communicating with all PSW.
  • PSWs Supporting Special Education Children
    The personal support workers who are working to support special needs children in all aspects of their life would benefit from a centralized platform that allows for progress management.

How Does it Work?

All personal support workers would be given access to the child’s profile and each PSW worker would have a respective section where they would be able to upload documents, add updates, and keep track of the child’s progress. Over the period in which they are supporting the child, each PSW would also have access to the other PSWs sections to be able to see their updates as well. Parents would be able to control who has access to each section, for example a parent might not feel comfortable with a tutor seeing the physical therapists updates, so the tutor would only have access to the school teachers updates. The control of visibility would be determined by the parents and the respective PSW. However, each PSW would have a dashboard where all the updates from other PSW would be centralized and organized so that they could stay in the loop with the students’ progress through written documentation. 

Further, our platform would include integrated survey and questionnaire methods that allow parents and PSW to keep track of progress being made using assessment methods that could then be extrapolated to find patterns and helpful data. 

Platform Outcomes

The centralized platform would mean that all the information and required documents would be added to the platform by individuals. Each individual would need to have a place to store their respective materials as well as one place where all the updates could be easily displayed, preferably in a chronological order. Further, this dashboard would act as a database that allows parents and PSW to search for information if they need to reference anything. 

Technical Components

We intend on deploying our product ona cloud-based customer relationship management (CRM) platform. The benefit of using a CRM platform in a healthcare management setting, is that it includes several automation and integration features that would make catering our product to several PSWs more inclusive. For example, being able to integrate Google Classroom schedules as well as an Outlook calendar into a centralized calendar system ensures that all important dates are automatically populated. Further, contact management and pipeline management are needed to help track and manage progress and internal development. 

Salesforce would be an ideal platform, as it is expansive, versatile, and scalable depending on the team’s needs, and the cloud-based portal would make the platform accessible. However, a limitation to using this platform is that the service is not free for small business or individual users. Meaning, it is more cost effective for the development of our prototype to look elsewhere and find a product that is more financially accessible in the time being. 

Similar CRM technologies include Hubspot, Zoho, Freshsales, Insightly, etc.  

For the demonstration of our tool, we plan to use Hubspot as it is more user-friendly on smaller scales and has more affordable plans. In the Free CRM Plan, the automation function is limited, and requires upgrade and payment. It can also be easily integrated with other external applications for file storage, spreadsheets, emails, databases, etc. 

Limitations 

Our main limitation is to ensure that the healthcare management system must comply with HIPPA health regulations and privacy concerns. 

Spam prevention powered by Akismet