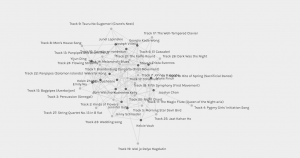
My first impression of the graph is that this is a telling example of the web structure and how information is connected through their relatedness in the internet. By showing the connections between the nodes(curators and songs) and edges(selections), it provides a visual display of the similarities in song choices among curators, making this data available for further investigation. It is easy to see which songs were selected by more curators or which curators had similar song choices.
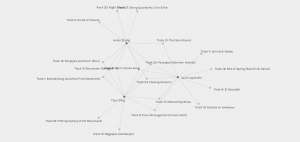
However, the graph does not reveal the underlying reasons that affects curators’ selections. Taking the above graph as an example, it illustrates the overlaps among this group of curators, while the rationales behind the song choices remain unknown. Viewers can only assume that these curators were probably using similar criteria without getting any details into which set of criteria was being used. In order to have a better understanding of the reasons behind the choices, viewers will need more information about the music in terms of genre, cultural origin, instrument being used, etc. In other words, another set(s) of data will be needed for a more precise assumption that would reflect the rationale to certain extent. I do not think that this data would fully reflect the reasons behind the choice because the viewers are also using their subjective ideology when interpreting the results.
There is no doubt that technology, such as algorithm, has made collecting and comparing information/data more convenient. When we click on a link, browse web pages, and watch a video, these actions were interpreted into data, which was in turn used to assume what content we are interested in as users. Nevertheless, it takes further analysis to best guess the intention behind the actions and why it matters to the users.