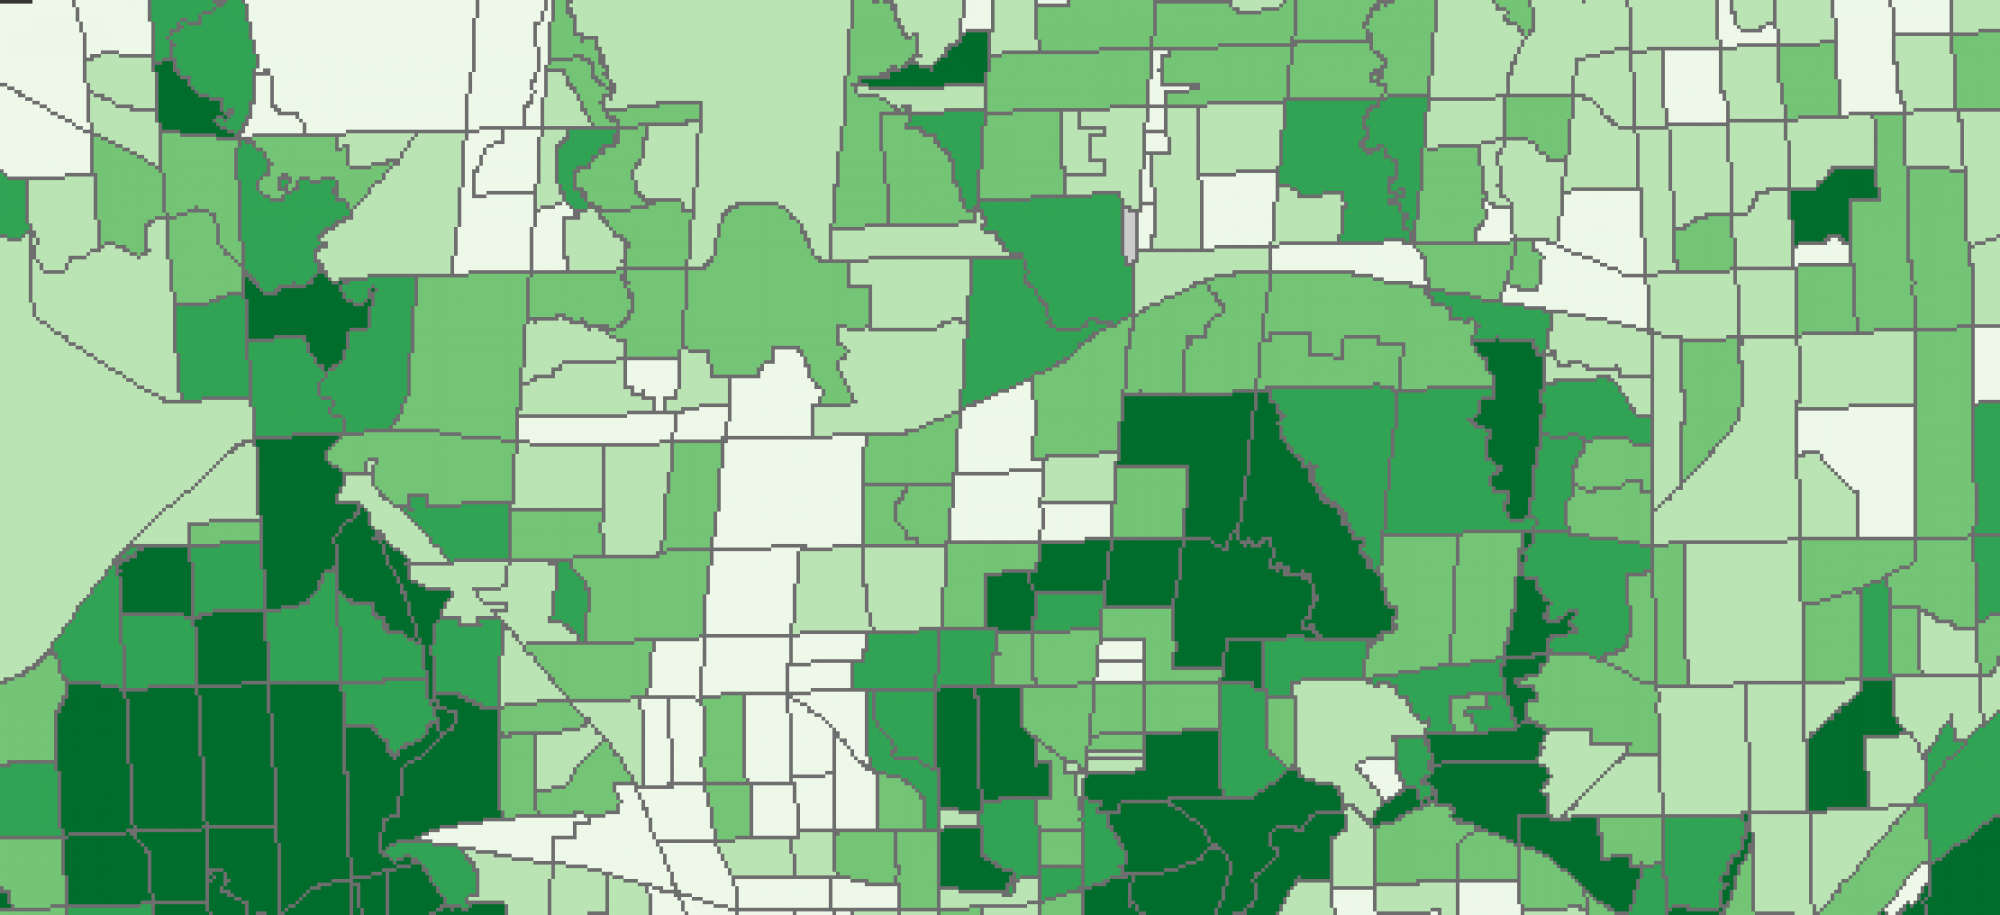
Statistical analysis is a key component to many analyses of spatial data. This week in the course we reviewed general terms and concepts in statistics that could be used in order to interpret and analyze data for use in spatial analysis. Statistics can be used to summarize distributions and describe data sets. There are measures of central tendency like the mean, median and mode which are meant to be meaningful measures for the center of data distributions, each of which can be used in different scenarios to account for different distributions of data values. For example, if the range of data within a set is small, finding the average of all points could a suitable representation of values within the data set. In contrast, if a data set has a large range of values and lots of outliers, perhaps the median would be a better measure for central tendency as it would take the value from the center of the distribution and account for skewing within the data(this is better for variables such as income). From there, measure can be calculated which describe the variance within a data set. Standard deviation is a popular measure which describes variance in the data as it represents the average deviation from the mean. If a value is associated with a lower standard deviation, it is closer to the average of all data values and vice versa for values with associated with a higher standard deviation. These are common basic descriptive statistics that help to understand data and simplify datasets for analysis.
After descriptive statistics are established, a whole suite of analysis can be performed to look at relationships and correlations between variables. Statistical models such as ordinary least square regression, geographically weighted regression or hotspot analysis can use summary statistics to identify statistically significant relationships and clusters within or between sets of data. These can be useful for trying to describe certain phenomena or processes or identify underlying patterns looking into why the phenomena is occuring. In all, statistics and statistical analysis are key for summarizing observed phenomena in the real world and for trying to explain processes in a meaningful manner.
