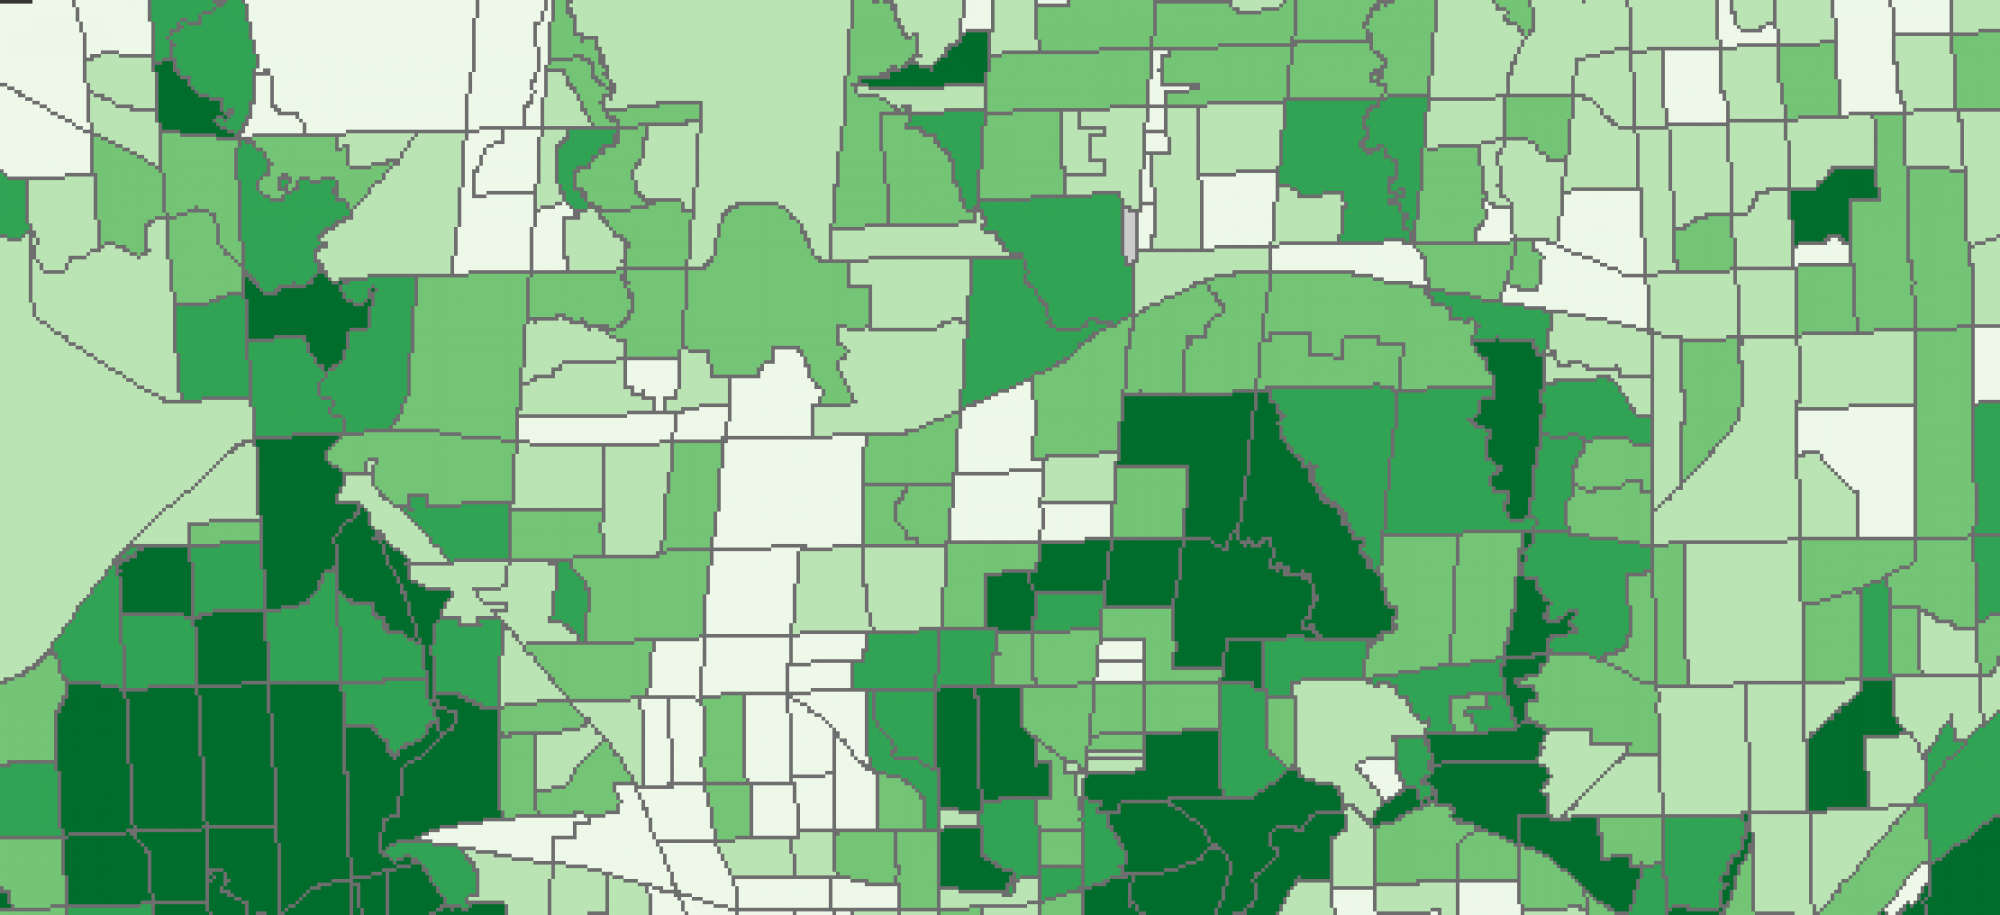
In lab one we used ArcMaps model builder in ArcGIS to perform a temporal hot spot analysis on heart disease mortality rates in the southern United States. Heart disease mortality data was first acquired from the Center for Disease Control and Prevention (CDC) wonder database. Using model builder we created county level feature classes for each year between 1999 and 2016 with their respective heart disease mortality rates. Then, using similar row iterators, hot spot analyses were conducted for each year. ArcMap’s HotSpot analysis (Getis-Ordi G) identified significant spatial clustering of areas with high heart disease morality rates (hot spots) or low heart disease mortality rates (cold spots). This makes it possible to identify regional patterns of heart disease mortality in space and time throughout the southern United States. In figure 1.1 below, you can see hot spots and cold spots of high or low heart disease mortality for the year 2010. By performing this analysis every year between 1999 and 2016 you can see how patterns of high heart disease mortality change over time. By doing so you can look at problem areas, like central Texas in figure 1, and hypothesize different potential causes. Perhaps people in this area smoke more, have lower incomes or less access to health care etc.
