Lab 3 introduced the geographically weighted regression, a spatial statistics tool meant to account for variance in the explanatory power of dependent variables in a study. Traditional a spatial ordinary least squares (OLS) regression only computes a global R-squared statistic for a full study area. Two major assumptions are made in the performing of OLS regression, the first is that values are randomly distributed across space and the second is that explanatory variables exhibit stationary (there relationship with the independent variable doesn’t change across space). Unfortunately spatial data violates these two assumptions more than not as objects closer in space tend to reflect the values of each other (signifying spatial clustering) or objects may be dispersed in space in a way that is not random. These are examples of positive and negative spatial auto-correlation. OLS regression also assumes stationarity in explanatory variables however in most cases explanatory variables exhibit non-stationarity. This refers to the varying degrees to which an explanatory variable actually explains a phenomena over space. This is why GWR is particularly useful as it performs local regressions for each feature in a study area, taking into account the effects of proximity with its closer neighbors.
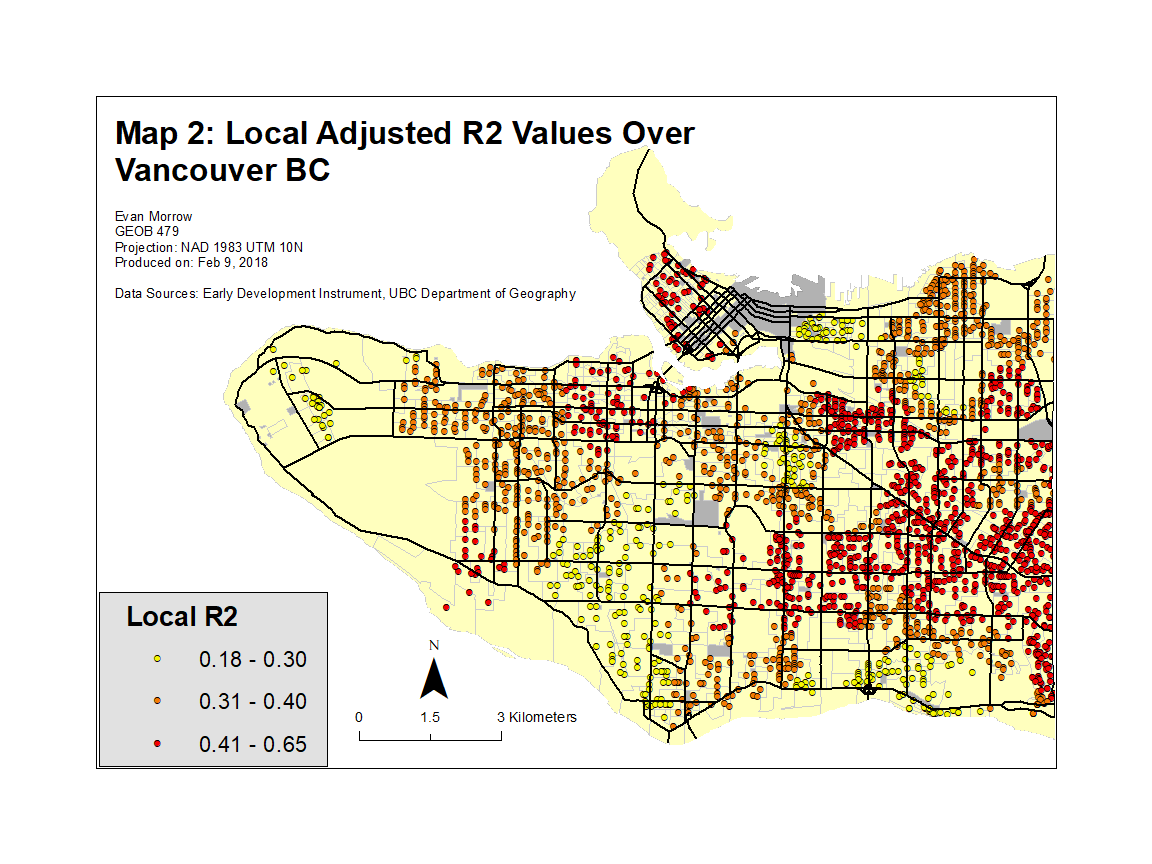
In this lab we used GWR to explore the varying explanatory power of different socio-economic variables to explain social skills score achieved by children derived from the early development instrument (EDI) questionnaire. Our analysis used variables like household income, proportion of visible minorities, proportion of recent immigrants or gender to explain the social scores of children in schools throughout Vancouver. As shown in figure 1 below, the properly specified variables chosen for our GWR analysis explained observed social skills score differently over space. Where points are colored red our model had the best explanatory power, while it had the lowest in areas with points colored yellow. The presence of yellow points means that our model was missing variables which may have explained the observed social skills more in that area.