Week 2 focused on geographic and landscape metrics such as patterns, processes, and scale. We discussed some issues between pattern and scale, which is deemed the central problem in ecology. As there are different spatial and temporal scales, as well as different ecological organizations, it is very difficult to decide at what spatial and temporal scale an ecological phenomenon should be studied.
Due to the geographic nature of the software, GIS almost always maintains some level of spatial autocorrelation. That is, if the presence of some quantity in a sampling unit makes its presence in neighboring sampling units more or less likely, that phenomenon exhibits spatial autocorrelation. This is contrary to spatial statistics, which assumes that everything is random.
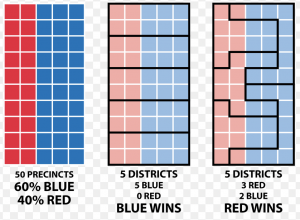
One particular way that spatial autocorrelation exhibits itself is through MAUP, or the modifiable areal unit problem. This problem arises when different areal arrangements of the same data produce different results. One example of MAUP in the real world that I believe is quite relevant in todays day and age is gerrymandering. The figure below exhibits this phenomenon perfectly. Depending on how governments divide census units, they can in essence force an election to go in favor of Democrats or Republicans.
.
During analysis, a spatial analyst must be extremely careful in how they approach MAUP.