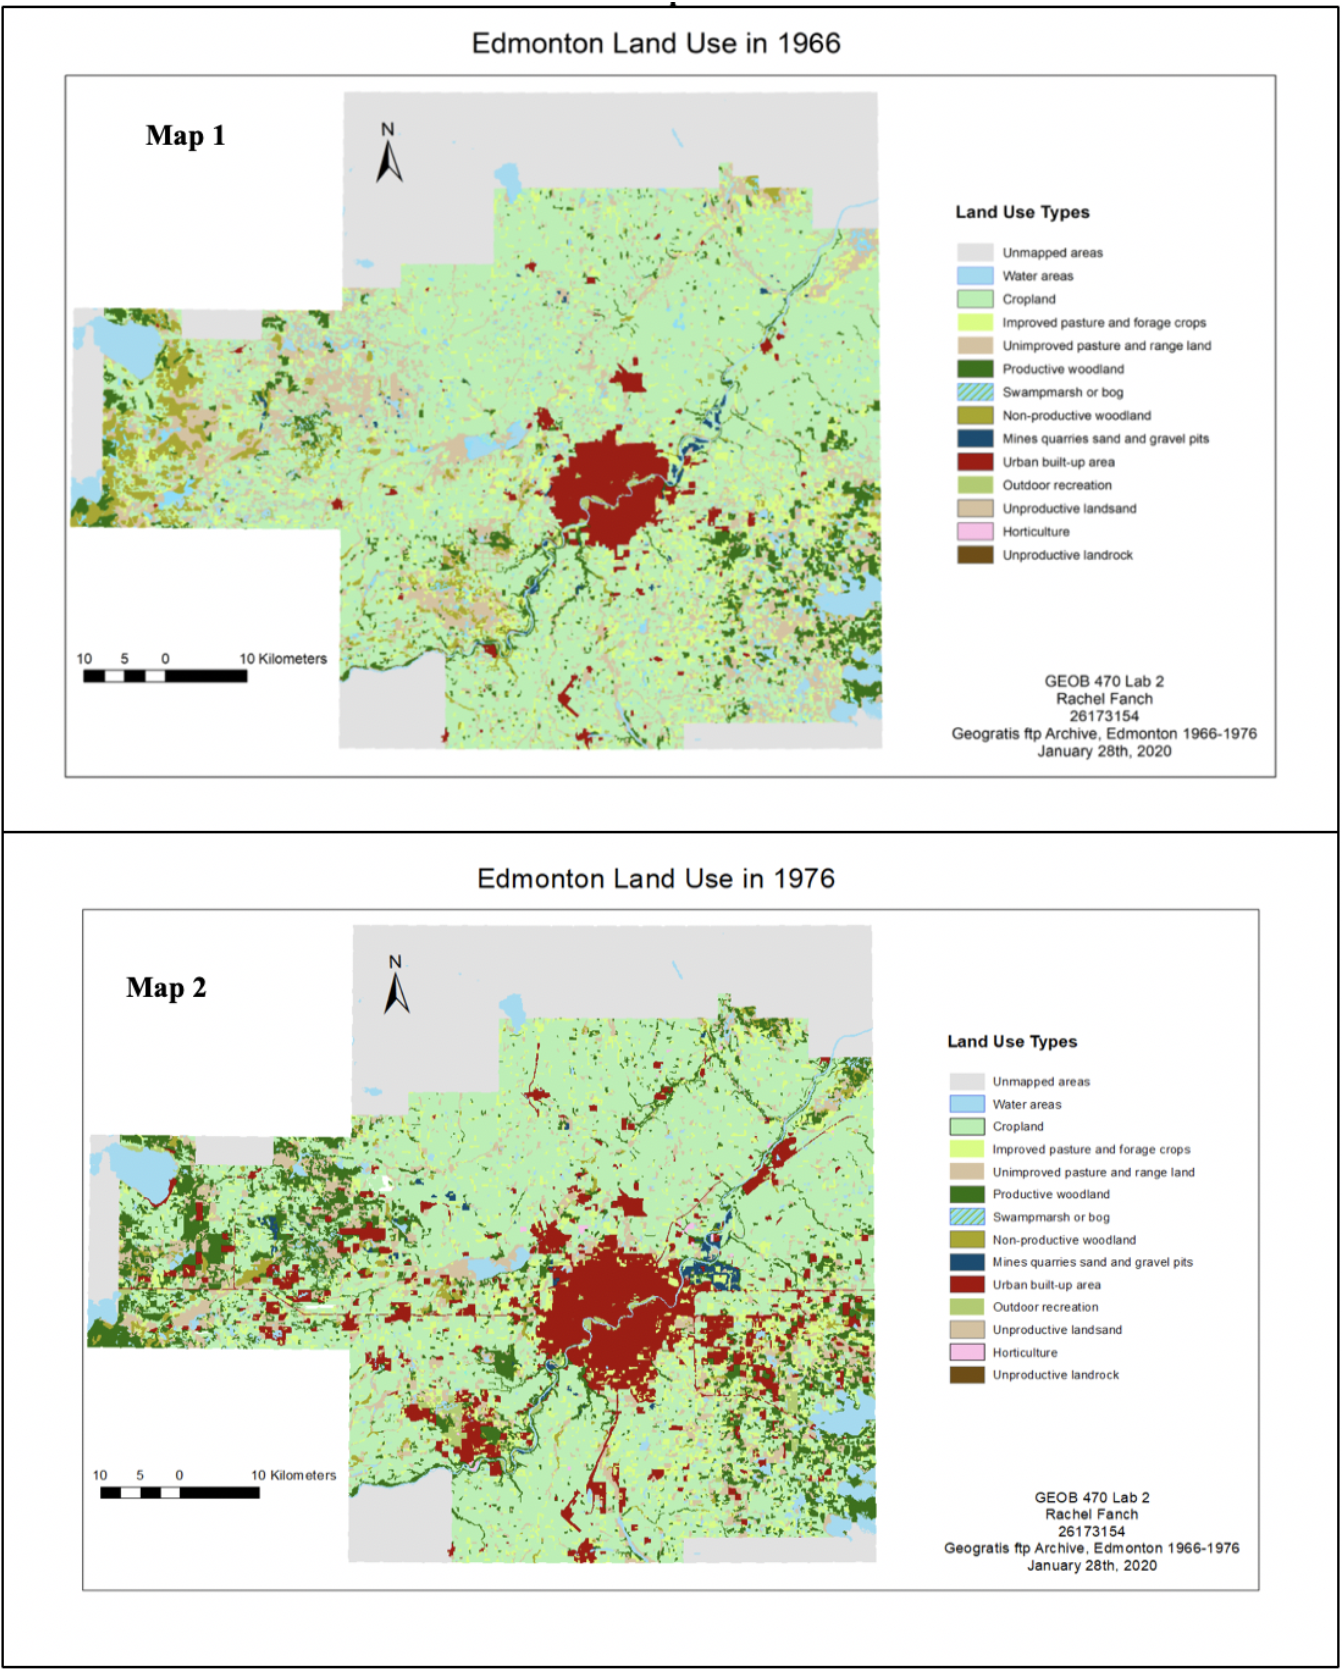
This analysis was conducted for the City of Edmonton to aid them in properly managing their city, as well as the regions beyond. The following report depicts ways in which the landscape has changed from 1966 and 1967. Overall, a large proportion of land use change has been converted into urban landscape as well as productive woodland, resulting in urban areas increasing 181% in size and productive woodlands increasing by 109%. While the increase of productive woodland and urban landscape point to a growing economy, the City of Edmonton should be careful of their encroachment on cropland, as there was a 7.5% decrease in this land use from 1966-76. As the report shows, the main land use that cropland was converted into was urban areas (approximately 7.5%). In order to support the local agricultural economy as well as the livestock industry, cropland ought to be preserved. It is also worth mentioning that while the mining industry seems to be growing in Alberta with an increase of 85% (1,681 km2 in 1966 versus 3,116 km2 in 1976), approximately 21% of land use denoted as mines and quarries was converted into urban areas. While the reclamation of mines can be an optimal switch, it is important to pay attention to these areas, as there is potential for hazardous materials as well as unsafe foundational conditions. It is also encouraged that the city attempt to preserve whatever swamp/marsh remains.
The impacts of the urbanization of Edmonton can also be seen by analyzing Fragstat landscape metrics. For example, the total number of patches (NP) has decreased overall from 8496 to 8287. However, the total number per land use has increased for certain land uses, such as cropland, productive woodland, and urban areas. The total core area (TCA) also shows an overall increase since 1966, but again some, such as cropland, show a decrease.
While this may signify increase in timber operations as well as overall urbanization, this could mean trouble for agricultural croplands. TCA is calculated as the area of the patch minus a specified edge depth, which in this case was set to 100 m. Core area is often preferred by many species of flora and fauna alike, as this area is often more protected from the elements and predators, and is impacted less by surrounding land uses. Unfortunately, TCA has shown a decrease for cropland, which could reduce crop yields. This is likely due to the fact that cropland is relatively easy to build upon, as it is quite flat, and it is also easy to convert into other land uses, such as productive woodland. Where there once was an abundance of cropland and unproductive woodland now maintains quite large parcels of urban area and productive woodland.
The number of disjunct core areas (NDCA), which is the same as NP minus the edge depth, also decreased by 31% between 1966 and 1976. This is likely because edges of approximately 100m were removed to allow urbanization through roads and buildings. While there was a decrease for croplands, what is more staggering is the 336% NDCA increase of urban areas. What this likely signifies is patches of urban area becoming larger, while NP signifies the spread of individual patches of urbanization across the landscape. This suggests that while NP increase is occurring simultaneously with NDCA increase for urban areas, NP increase and NDCA decrease is occurring simultaneously for cropland.