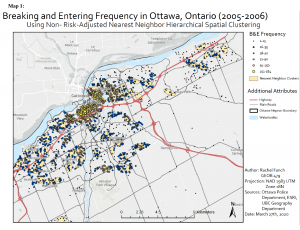
Using the CrimeStat application to conduct Nearest Neighbor Analysis, Fuzzy Mode Hot Spot Analysis, Nearest Neighbor Hierarchical Clustering, and Risk Adjusted Hierarchical Clustering, the relative risk of crime as well as crime hot spots for Ottawa were modeled. Only one map, and therefore one form of analysis, is displayed in this post. When looking at the result below, it is evident that the majority of fuzzy mode clusters with higher incidents of B&Es are also included within the NNH clusters. The higher number of B&E incidents occur in the downtown core, which is illustrated by the fuzzy mode results. The NNH results also mimic the fuzzy mode results, as there are many more clusters within the downtown core. They are also closer together. As shown in Map 1, there are very few ellipses that also include smaller fuzzy mode results (particularly values from 1-15).
