


Figure 1. Can you guess what this is?

Figure 2. Can you guess what this is?
Do you know what these images are?
That was the question I asked my friends on Instagram. Most of my Mexican and Latino friends knew exactly what the images were, while my Canadian, American and European friends did not.
What about you? Do you know what these images are?
If you do, I will assume you grew up or have been in a place where drinking water directly from the tap is not safe. If you have no idea what they are, it is okay. I will try to explain. Both images show tools that people use daily to facilitate serving water from a carboy.
In how many countries is it not safe to drink water directly from the tap?
I love random facts, so here is one. According to the Centers for Disease Control and Prevention (CDC), in 187 countries, you cannot drink water directly from the tap. The Globehunters (2019) published the following infographics showing the places where, as a tourist, it is safe and unsafe to drink tap water.

As you can see in the infographics, the countries with drinkable water are mostly the ones cataloged as “Developed countries” or “High-income countries.”
While it can be annoying for tourists from developed countries to travel to destinations where they can no longer drink water directly from the tap, most of the world has to pay for every single cup of water they drink and not just for the holidays, but for their entire lives.
As a developing country citizen (Mexican) who lives in a so-called developed country (Canada), I found the tremendous differences in access to drinking water across countries fascinating and frustrating. In this article, I will use the example of water quality to discuss the Kuznets Curve.
Tap water and the Kuznets Curve
After a year of drinking tap water, paying for a water bottle made me think of the Environmental Kuznets Curve (EKC) that we explored in my Environmental Economics class at the University of British Columbia (ECON 371).
The EKC, broadly speaking, represents the hypothesized relationship between income per capita (how much money a person makes on average) and environmental degradation. As you can see in Figure 3, in the beginning, with low income per capita, environmental degradation increases until it reaches a maximum. Then it decreases as income per capita keeps increasing (Stern, 2004).
The EKC is named after Kuznets (1955), who hypothesized that income inequality is an inverted U-shaped function of income per capita (Stern, 2004).
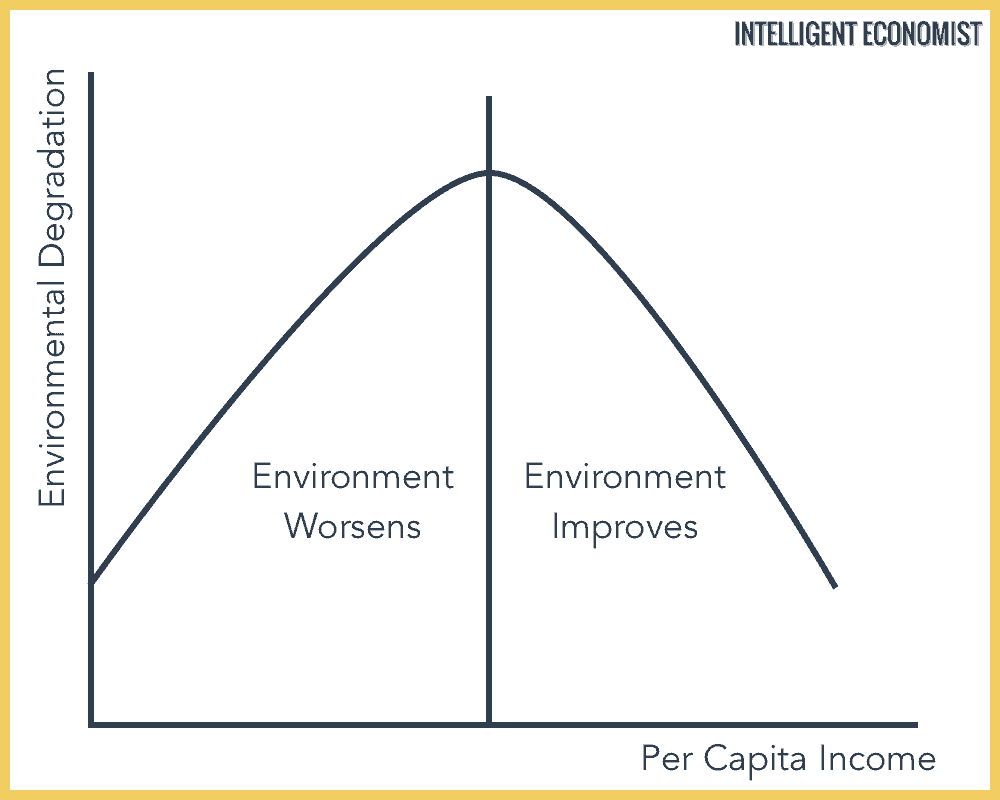
Figure 3. Environmental Kuznets Curve
If you do not like graphs because you think they oversimplify the complex world, I totally agree with you. However, remember that while all models fail to accurately represent the world, some models are useful.
The graph could be used to explain why in some countries you can drink tap water while in others you cannot. It would also explain the difference in water quality across different countries. If we are optimists, the Kuznets curve can even give us hope that as income per capita continues to increase beyond the turning point, we would not only afford to have more stuff, but the quality of the environment would improve as well. Best of both worlds, right?
At this point, the hypothesis seems too good to be true.
So I did some reading. I found that many researchers in different parts of the world have analyzed data to see if the hypothesis holds true for different environmental indicators. Soumyananda Dinda, in his paper “Environmental Kuznets Curve Hypothesis: A Survey” (2004), analyzes EKC papers that have used municipal solid waste, urban sanitation, access to safe drinking water, energy use and traffic volumes, etc. to test the hypothesis. He found that most of the indicators do not support the EKC. He also found that:
1.- Environmental problems that directly impact human health (such as urban sanitation and clean water) tend to improve steadily with economic growth.
2.- When environmental problems can be externalized (such as municipal solid waste), the curve does not fall at high-income levels.
His findings are consistent with what Field discusses in his book Environmental Economics (2017).

Figure 4. Environmental Indicators in Relation to Country Income Levels
Before I jump to my conclusions, I would like to add the two critical assumptions of the EKC. I hope the assumptions would make you think about why the EKC does not hold for certain indicators, and how we could use the information that the model provides.
Two critical assumptions about the EKC are: Environmental degradation has to be reversible, and as people become richer, they care more for the quality of the environment (Dinda, 2004).
Conclusions
Environmental quality varies greatly across the globe. An example is that some countries have drinking tap water while others do not. The Environmental Kuznets curve reflects the hypothesized u-shaped relationship between environmental degradation and income per capita. However, most empirical evidence does not support the EKC. Researchers have explored different reasons why the EKC does not hold. More research needs to be done to better understand and tackle environmental degradation and climate change.
References
Dinda, S. (2004). Environmental Kuznets curve hypothesis: a survey. Ecological economics, 49(4), 431-455.
Field, B. C., & Field, M. K. (2017). Environmental economics an introduction. The McGraw-Hill.
Stern, D. I. (2004). The rise and fall of the environmental Kuznets curve. World
development, 32(8), 1419-1439.
Images:
Figure 1. https://chrisalim.net/wp-content/uploads/2020/07/BOM-1306-04.jpg
Figure 3. Environmental Kuznets curve obtained from https://www.intelligenteconomist.com/kuznets-curve/
Figure 4. Environmental Indicators in Relation to Country Income Levels http://ndl.ethernet.edu.et/bitstream/123456789/43102/1/4.pdf (p.425)