Greater Vancouver Accessibility: Description of Project, Study Area, and Data
Accessibility of Greater Vancouver for Wheelchair Users (includes slope, rental affordability, public transportation and service density)

Accessibility by Rental Affordability, Public Transportation and Service Density


The following report will provide an in-depth analysis of maps created in ArcMap GIS to evaluate accessibility in Greater Vancouver and the City of Vancouver, critiquing the data, methodology and analysis tools employed. Quantitative data sets, including raster and vector files, will be used to generate choropleth maps, heat maps and plot point data. We will use slope standards for ramp manufacturers, combined with a street maps and transit stop point data to generate a map highlighting zones of greatest physical accessibility in Vancouver by constructing “accessibility buffers”. Therefore, we define physically accessible areas as those that lie on streets within a certain distance of a public transport stops (SkyTrain and bus), based on City of Vancouver and Coastal Health guidelines. Yet, we will problematize this narrow notion of accessibility by combining our physical analysis data with indicators of social and economic accessibility, namely service accessibility and normalized rental costs. For the purposes of this analysis, the following definitions and assumptions will be employed:
- Individuals only have access to public transportation including busses and the SkyTrain;
- Physical disabilities will be will be defined as any limitation on a person’s functioning, mobility, dexterity or stamina that significantly impacts or more major life activity (Study.com, 2016);
- The average speed of an electric/powered wheelchair is 8 kmph, exceeding the average walking pace of just 3.1kmph (Hoveround.com, 2013);
- An “accessible” distance away from a bus or SkyTrain station is considered to be 5 minutes;
- The slope of an area will be considered “accessible” if it has an 8% rise or less (Building Access Handbook, 2014).
The datasets that will be employed come from a variety of sources including VanMap, British Columbia Research Library Data Services, Vancouver TransLink, the University of British Columbia’s Department of Geography database, and Statistics Canada about accessibility. The below list of featured spatial datasets will aid in assessing which areas of Vancouver are deemed most accessible:
- A list, distribution map and point data for all TransLink bus stops in the Metro Vancouver Area;
- A list and distribution map of all schools, community centres, health care facilities, cultural spaces, and public parks in the Metro Vancouver Area;
- A digital elevation model (DEM) for the Metro Vancouver Area;
- A spatial map of all Metro Vancouver roads; and
- Census tract data concerning the rental affordability of housing in Metro Vancouver.
The most accessible areas in Vancouver will be determined based on their proximity to each of the amenities and resources listed above, as well as local housing prices. While there are many aspects that impact accessibility, we contest that geography and topography are integral when it comes to making a decision about where to position one’s self as a physical disadvantaged, independent individual that relies on public transport. Thus, the priority for determining the accessibility of an area will be based on distance from public transportation, services, and the slope or gradient of roads or sidewalks in the area. Combining these data sets, we will identify physically accessible areas, overlaying clustered services and lower cost areas to determine a compromised, broader accessibility.
Compiling our spatial findings to identify service gaps, our report will function as a guideline for locating additional residences and services, as well as identifying locations that should enact especially strong building regulations based on their zone’s geographical and physical accessibility.
HYPOTHESIS
Based on our existing understanding of the socioeconomic and physical geography of the Metro Vancouver and the different factors we intended to explore, we predict that Downtown Vancouver and Kitsilano are the most “accessible”.
METHODOLOGY OF ANALYSIS
Our project focused on two scales: the city of Vancouver, defined by the municipal government, and the Greater Vancouver area, as defined by census Canada. In order to compile census, municipal, and institutionally-gathered information to determine spaces of accessibility, we use used ESRI’s ArcMap 10 software to compile layers, edit information and perform normalization calculations. In order to compile this information, we used a wide variety of spatial tools including clip, intersect, merge, union, raster-to-polygon conversion, dissolve and project. We also performed non-spatial analyses, using the field calculator and the select-by-attribute function.
To determine accessibility at the smaller scale of Greater Vancouver, we initially combined elevation data in the form of a Digital Elevation Model (DEM), hydrology, roads, bus stops, and rapid transit stations, creating buffers around the combined transit stops. We created 2 buffers, the first of 129m and the second of 417m. 129m represents a 5-minute distance for those using a manual wheelchair, based on the average push speed of 8.6 mps, (Sonehblum et al., 2012). The second buffer of 417m indicates a 5-minute radius, determined from an average walking pace of 5km/hour, as electric wheelchairs and scooters able to exceed this speed for over 20 minutes (Hoveround.com, 2013). Areas outside of these two buffers were deemed least accessible.
We then used the DEM to create slope information. Due to the DEM’s pixel size of 25m, we considered maximum ramp grades for ramps exceeding 25m. Using the guidelines of the British Columbia Building Access Handbook from 2014, the maximum gradient for accessibility was determined to be 1:12, or approximately an 8% incline. We used this grade to remove areas that were too steep for a manual wheelchair user from within the 129m buffer.
However, we argue that accessibility is not merely physical, but must consider the social and economic dimensions of accessibility. To this end, we incorporated housing price data as a loose surrogate for economic accessibility, using median rental prices over census tracts collected by Census Canada. We normalized rental costs by the average number of rooms for the census tract.
To address some of the social wellbeing dimensions of accessibility, we incorporated service information. Using point locations for health and education services, we created a density map across the region to identify sites of service clusters, setting the parameters of the raster layer to the extent of Greater Vancouver and the cell size to 25m, in keeping with the DEM and acknowledging the ground extent of buildings.
Having spatialized the information of these three forms of accessibility (physical, economic and social), it was evident that the accessibility criteria yielded often contradictory accessible spaces. Seeking to explore the compromise between these three components, we classified each layer using natural breaks and three classes. We assigned new values between one and three for each of these classes, one being the most accessible (cheapest rental, most services or within the most constrained buffer zone) and three being the least accessible (most expensive rental, least services or outside of the two transit-accessible buffers). With these normalized values it was possible to combine the three layers – using the union tool – to derive a single score.
The greatest accessibility was clearly within Vancouver and a greater array of socio-cultural feature information was available for this larger scale, spurring us to develop a map of the City of Vancouver. The additional features included were community gardens and farms, cultural spaces, homeless shelters, and community centers. Combining these with existing information on education and health, we created a new density map, classifying it once more into three classes using natural breaks.
We clipped the existing physical accessibility information and normalized rental rates to the city of Vancouver extent. We reclassified the rental rates, using natural breaks and assigned normalized values of one to three for each of the classes, repeating this classification between one and three for the physical accessibility and service layers. Finally, we unioned the physical, economic (housing) and sociocultural (service) layers, calculating a common, composite accessibility score and symbolizing accessibility using manual breaks to determine accessibility in the City of Vancouver.
DISCUSSION & RESULTS
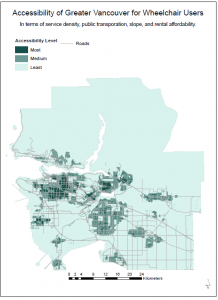
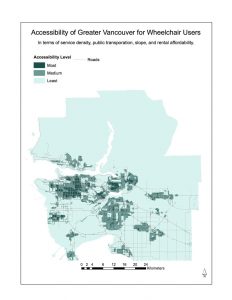
Our analysis led to the creation of 4 maps, and aided in highlighting a variety of key trends. Each of the layers and datasets included illuminated various facets of accessibility in Vancouver; when all of these layers are taken into consideration, there are few arguably “accessible” areas in Vancouver as seen in fig. 4. General trends show that the most “accessible” regions of the City of Vancouver in terms of slope, distance to transit stops, access to services include Yaletown, the Downtown Eastside, and Strathcona. If we consider the Greater Vancouver Area as a whole, commercial centres in Surrey, Delta and New Westminster are also considered to be accessible.
Most Accessible Neighbourhoods in Metro Vancouver
(Slope, Access to Transit, Service Density)
- Yaletown
- Downtown Eastside
- Strathcona
- Olympic Village (and immediate surrounding area)
Fig. 2 is a map that helps visualize the regions that have been deemed accessible solely based on slope and proximity to transit. Regions that fall within the medium shade of blue indicate the areas that fall within the ‘accessible’ buffer zone or distance, which has been deemed 417m. Within this 417m range, we have also defined a smaller range of 129m that applies to individuals using a manual wheelchair who are not able to travel as quickly in a 5 minute time period. This map also highlights areas that are out of range, usually accounting for regions that are not accessible by transport, but also very steep. These regions include places like Wreck Beach, Tower Beach, and the south-western corner of Vancouver.
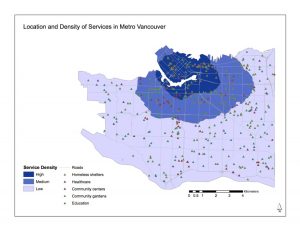
In looking solely at services (fig. 1), it is apparent that the downtown core of Vancouver has the highest density of services. These services include health care facilities, community centres, community gardens, education facilities, and homeless shelters. Density in the form of a heat map, as well as point data are provided in fig. 1 to allow the reader to understand distribution specifically and as an average. The map clearly shows that the farther away from the downtown core one moves, the lower the density of services.
One important aspect to note is that there are more homeless shelters clustered in the downtown area, specifically the Downtown Eastside. Not only may this have skewed the data and increased the average and density, but is indicative of larger socioeconomic trends in the city. This area has a higher than average (compared to the rest of the city) homeless population, which accounts for the presences of homeless shelters. While geographically this area may be most suitable and accessible for people with mobility issues, there are other qualitative factors that may deter individuals from living or working in a certain area.
Another area whose services cater to those with mobility issues is the corridor that runs North-South between Granville Street and Cambie Street. This is best seen in fig. 1 when looking at the region where the density of services transition from Medium to Low. Provided that proximity to healthcare was a primary concern, this area would considered very desirable; however, there is a new hospital and variety of healthcare facilities that are being constructed in the region with the highest density of services, making the area perhaps more accessibility with those who require immediate health care to help cope with their mobility issues.
Most Accessible Neighbourhoods in Metro Vancouver
(Slope, Access to Transit, Service Density AND Rental Affordability)
- Downtown Eastside
- Strathcona
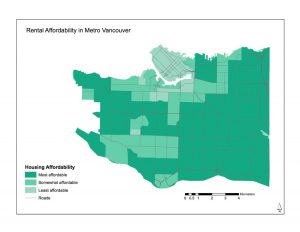
Beyond looking at the locations and densities of service, it is important to understand that accessibility is not only about the physical limitations, but potential socio economic and monetary constraints further limit accessibility, problematizing notions of merely physical accessibility. To provide some more background information and insight, please see Figures 1.1 and 1.2 in the appendix, as they indicate the average rental rates in Vancouver as well as the amount of disability income for which individuals are eligible. This indicates that the maximum about of shelter monetary assistance that could be provided is $1093.06/month, which is less than the average rental rate for a 1 bedroom apartment in Vancouver as seen in Figure 1.2 at $1,832/month. While fig. 3 doesn’t include the Greater Vancouver Area, it is important to note that rental rates for housing outside of the Vancouver core are substantially lower, averaging $861/month.
Spatializing this tabular concerns in fig. 3 reveals that, in the case of Vancouver, economic factors of accessibility often conflict with physical and social accessibility, necessitating a compromised notion of accessibility. These trade offs between economic accessibility and socio-physical access, highlight the need for a multidimensional definition and approach to urban accessibility. Thus, identifying the compromise of accessibility underscores the need for more than the mere provision of public transportation to increase affordability, and instead the directed implementation of transportation and service location in areas of south Vancouver and Richmond with higher rental affordability and more accessible land, as determined by slope.Likewise, noting physical and service accessibility in Metro Vancouver in contraction to housing accessibility, contests a spatialized right to housing, with a right to housing – not only in Greater Vancouver – but in the socio-physically accessible downtown core.
ERROR & UNCERTAINTIES
Because we conducted no primary data collection, our analysis relied entirely on secondary data. Though we used well-established municipal or educational sources such as VanMap, Stats Canada, and the UBC data drive, some layers were not transparent about the methods of data collection and any potential errors in the data. Because of this and our lack of empirical testing, it is difficult to calculate errors in our data, although they likely exist. Much of the municipal data is updated regularly, but the timing of data collection was not standard between layers, which may have lead to outdated or inaccurate data. Additionally, the difference in timing between layers means that we cannot say our model is accurate to a particular month or year, including the present.
To create our slope layer, we relied on a Digital Elevation Model with a pixel size of 25 metres, which is larger than many of the small point features like transit stops that we are studying. This degree of generalization brings uncertainty and likely error to our slope analysis, as it is impossible for us to know the true slope of a smaller area from this data alone.
We did our best to consider all transit stops in the creation of these maps; however, the spatial data for rapid transit stops (SkyTrain stations) was only available for Vancouver proper. As such, we made the assumption that there would be no SkyTrain stations that did not have a bus stop within 417m of it. This is based on our existing understanding of transportation within Vancouver, knowing that bus and SkyTrain transportation routes overlap at most major stations to accommodate comprehensive coverage of the Greater Vancouver Area.
In order to make our analysis feasible, we had to make a number of educated assumptions about the life and mobility of individuals with mobility challenges in Vancouver. Though we relied on accepted guidelines and measurements of electric and manual wheelchair use when possible, the size of our buffer zone for wheelchair users should not be taken to reflect any individual or average mobility. In addition, this report does not take into account the existence of accessible HandyDART ride-share vehicles, personal vehicles, or the accessibility of individual buildings and services, all of which could significantly alter our results.
To best create a visually appealing map that housed all of the necessary data, we opted for the use of a heat map rather than point data. Heat map for services shows only density as opposed to where they actually are. Furthermore, the services that are accounted for in the heat map include all services – not just the ones that have been deemed “accessible”. While inclusion of all services is beneficial because it provides a holistic understanding of service availability around the city, in term of application for someone with mobility issues, this may be misleading. This misrepresentation can be considered an ecological fallacy, as the heat map takes into account an average distribution of the services rather than individual, discrete data points.
The location and frequency of transit stops is crucial to this report and analysis; however, we have deemed areas within a 417m radius of stops accessible, despite the fact that in many suburban areas, there may not be an opportunity to live within such close proximity. This may be due to the presence of parks, large roadways, or because of the zoning of specific areas. It is important to recognize that each of the 417m radiuses indicates on our maps may not include areas suitable for residency for these reasons.
FUTURE RESEARCH & RECOMMENDATIONS
There are many potential factors that could be included in a GIS project to determine the accessibility or most accessible areas of any city. For this report, we have considered three major variables to evaluate the accessibility of Vancouver – slope, access to transportation and density of services. While fig. 3 looks at the rental rates, this was not a primary or initial concern of the project; however, it is unrealistic to conduct a study on accessibility without considering rental rates or housing costs, income, and budgetary constraints that may come with having a disability or mobility challenge.
The difference in rental rates between Vancouver – where there is a high density of services and facilities – and Surrey, where there is a low density of services but access to public transit, is striking. Given the same single income circumstance described above, it makes more sense for someone with mobility challenges to live in Surrey or another suburb to accommodate their presumed budget, access to public transportation, and geographical slope-specific requirements. Despite this justification, our primary research question was designed to illuminate the most accessible areas in Vancouver proper. While Surrey and other surrounding suburbs like Delta are technically deemed accessible, they fall outside of the scope of our primary mapping and analysis area.
The geographical information provided by compiling these datasets could be applicable for housing developers (i.e. those looking to build something like a 50 years+ condominium or housing specifically for individuals with disabilities) or for people looking to move into or within Vancouver to better accommodate their mobility needs. This information could be used by realtors to help their clients assess what areas may be the best fit for them; however, rental rates and income are crucial in ultimately making this decision and therefore should be considered and evaluated more in depth than they have been in this report.
Beyond the further exploration of rental rates and budgetary constraints, there are additional datasets that could make this analysis even more useful and realistic. In addition to the digital elevation model that was used to calculate slope, it would be ideal to have some indication of sidewalk presence and general curb height in specific areas as these also may impede one’s mobility.
CONCLUSION
The report above attempts to assess which neighbourhoods in Vancouver are most “accessible”. This evaluation has been conducted by looking at a series of datasets that help understand the quality of life that an individual with a mobility issue may have with regards to ease of walking or independent transportation like wheelchairs (dependent on slope), access to public transportation (a transit stop within 417m if walking or using electric wheelchair, 129m if using manual wheelchair), and density/variety of educational, health, and cultural facilities in the proximity to transit stops. The evaluation shows that Downtown Vancouver, Strathcona, Yaletown and the region surrounding Olympic Village are most accessible in geographic nature; however, when rental affordability is taken into account, the number of accessible regions are limited to include only the Downtown Eastside and Strathcona in Vancouver proper, highlighting a compromise of accessibility dependent upon geographical and accessibility tradeoffs. In the Greater Vancouver Area, select areas in Delta, Surrey and New Westminster are also considered to be accessible.
WORKS CITED
“Building Access Handbook 2014: Illustrated Commentary on Access Requirements in the 2012 British Columbia Building Code,” British Columbia Office of Housing and Construction Standards. 2014.
“How Fast Are Power Wheelchairs?” Hoveround.com. May 2013. www.hoveround.com/help/learn-more/power-wheelchairs-101/how-fast-can-a-power-chair-go
What is a Physical Disability? – Definition & Types – Video & Lesson Transcript | Study.com.
(n.d.). Retrieved December 01, 2016, from http://study.com/academy/lesson/what-is-a-physical-disability-definition-types-quiz.html
Suite Rental Rates in Vancouver British Columbia | RentBoard.ca. (2016). Retrieved December
01, 2016, from https://www.rentboard.ca/rentals/rental_rates.aspx?locid=1040&psttyid=20
Soneblum, Sharon, Stephen Springle and Richard Lopez. (2012). Manual Wheelchair Use: Bouts of Mobility in Everyday Life. Rehabilitation Engineering and Applied Research. 7 Pages.
Study.com. (2016). http://study.com/
Disability Assistance Rate Table. (2016). Retrieved December 01, 2016, from
DATA SOURCES:
Statistics Canada. 2011. Accessed through Computing in the Humanities And Social Sciences University of Toronto. 2016.
TransLink Transit GIS Data. (n.d.). Retrieved December 1, 2016, from
http://dvn.library.ubc.ca/dvn/dv/ABACUSPD/faces/study/StudyPage.xhtml?globalId=hdl:11272/10254
UBC Geography Department, G:/ Drive database
Vanmap. (2016). Retrieved December 1, 2016, from
http://vanmapp.vancouver.ca/pubvanmap_net/default.aspx
APPENDIX
Figure 1 – Service Accessibility

Figure 2 – Public Transportation Accessibility

Figure 3 – Rental Accessibility

Figure 4 – Accessibility of Greater Vancouver for Wheelchair Users